My Financial Independence Journey » Stock Analysis » Teva (TEVA) Dividend Stock Analysis
Teva (TEVA) Dividend Stock Analysis
Teva (Teva) is and Isreal based pharmaceutical manufacturer. It is the largest generic drug company in the world. In addition to generic drugs, Teva produces several brand name drugs including Copaxone (for multiple sclerosis) and Agilect/Azilect (for Parkinson’s disease). Generic drugs accounted for about 51% of total sales in 2012, branded drugs for 40%, and OTC medications and other revenues for 9%. 51% of sales in 2012 were in the US, 28% in Europe, and 21% came from other regions. Teva is the largest generic manufacturer in the US, with its products accounting for about 14% of all US prescriptions in 2012. Teva has been aggressively expanding by acquisitions. In 2010 Teva aquired Ratiopharm, which made Teva the largest generic drug manufacturer in Europe. In 2011, Teva acquired Cephalon which manufactures drugs including Provigil and Nuvigil treatments for daytime sleepiness, and Treanda treatment for leukemia and non-Hodgkin’s lymphoma. Also in 2011, Teva acquired Taiyo, a leading Japanese generic drugmaker.
TEVA Basic Company Stats
- Ticker Symbol: TEVA
- PE Ratio: 19.75
- Yield: 2.8%
- % above 52 week low: 14.8%
- Beta: 0.74
- Market cap: $33.71 B
- Website: www.tevapharm.com
TEVA vs the S&P500 over 10 years
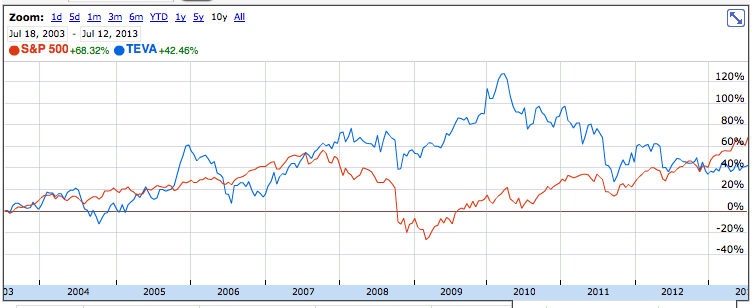
Other than a nice couple of years in 2009 and 2010, TEVA has roughly tracked the S&P500. Over that time, an investment in TEVA would have grown by 42% compared to the 68% that an investment in the S&P500 would have grown, which isn’t particularly impressive.
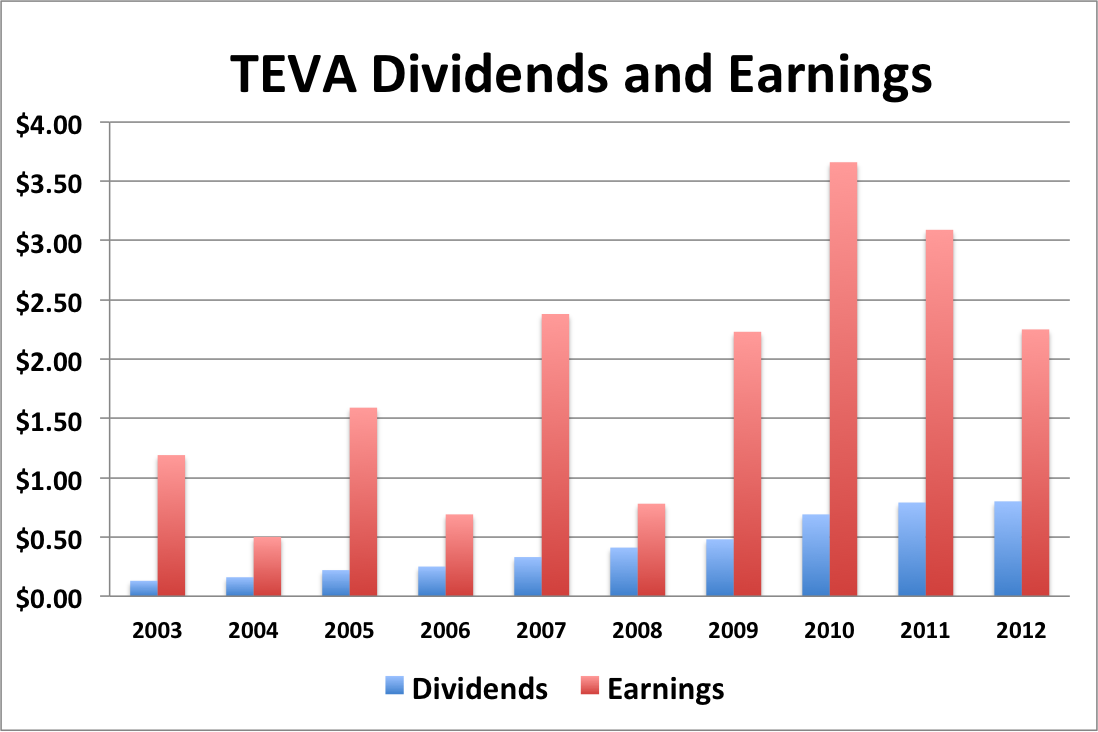
TEVA Earnings Per Share (EPS) & Dividend Growth
- 1 year EPS growth: -27.2%
- 3 year EPS growth: -21.6%
- 5 year EPS growth: 30.3%
- 10 year EPS growth: 7.3%
EPS growth for TEVA has been sporadic. EPS certainly appears to have grown since 2003, but not in anything that resembles a stabile fashion. Further precipitous drops in EPS like those seen in 2004, 2006, and 2008 may put the dividend at risk. I’m usually pretty lenient about a dip in EPS here or there since recessions or other economic factors can hit even the best of companies. But TEVA displays too many EPS dips for me to be comfortable.
- 1 year dividend growth: 1.3%
- 3 year dividend growth: 7.7%
- 5 year dividend growth: 18.2%
- 10 year dividend growth: 24.4%
Dividends have grown consistently over the last 10 years. However, it looks like that growth is decelerating over time, with the last year of increase being a meager 1.3%.
With a starting yield of 2.8% and a growth rate of about 4.8%, TEVA’s yield on cost will grow to well in excess of 6.8% in 10 years. In order to double the dividend, using the rule of 72, it will take less than 14.4 years.
TEVA Payout Ratio
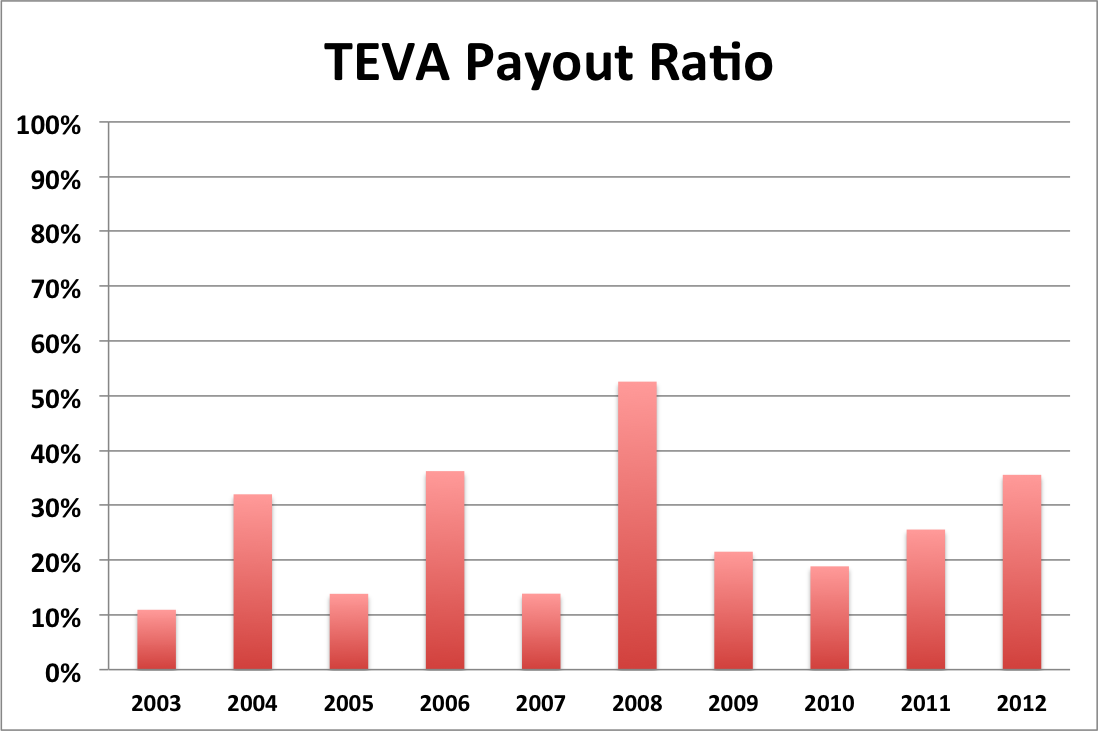
TEVA’s payout ratio has been relatively low, staying under 40 or 30% most of the time. There was a spike to slightly above 50% in 2008. TEVA’s average payout ratio for the last 10 years is 26%. Given the low payout ratio, TEVA should be able to increase its dividends far more than the paltry 1.3% that we saw last year. But if TEVA is expecting EPS to drop more, then putting the brakes on dividend growth makes sense.
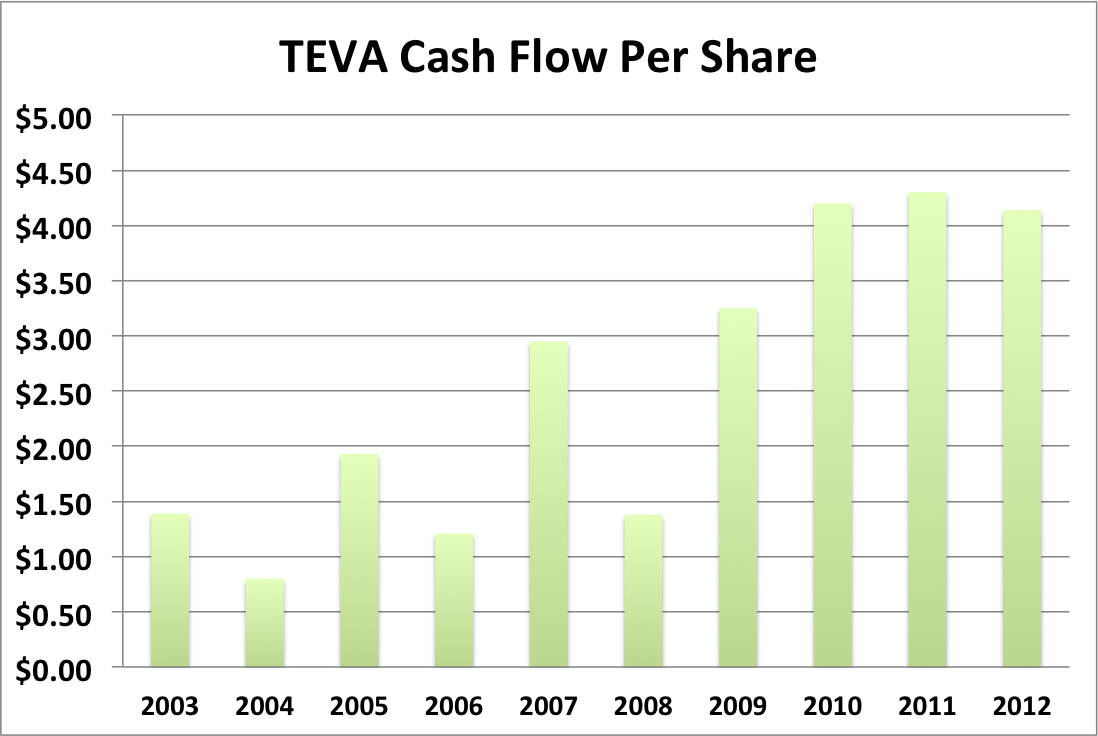
TEVA Cash Flow & Revenue Growth
- 1 year revenue growth: 10.9%
- 3 year revenue growth: 12.3%
- 5 year revenue growth: 16.4%
- 10 year revenue growth: 22.5%
TEVA’s cash flow has generally mirrored its EPS, complete with dips in2004, 2006, and 2008. However, unlike EPS which has been on the decline in the last few years, cash flow appears steady. TEVA has also done a great job of increasing it’s revenue over the years. While revenue growth appears to be declining, the numbers are still very solid.
TEVA Balance Sheet
The current debt to equity ratio for TEVA is about 51% and has been increasing recently, probably to help fund the recent acquisitions.
TEVA Risks
Teva faces two major risks. In regards to its generic drug business, there are relatively few barriers to entry and more and more companies are getting into the generic drug game. So competition is escalating and it remains to be seen whether Teva will be able to stay competitive. Through its acquisitions, Teva has obtained several brand name drugs, however it remains to be seen whether Teva can successfully manage these companies and produce any new brand name drugs on its own.
TEVA Valuation Panel
Graham Number
The Graham number represents one very simple way to value a stock. The Graham number for TEVA is $34.64. The stock price is higher than the Graham number, suggesting that TEVA may be slightly overvalued valued at the moment.
Two Stage Dividend Discount Model
Given the low level’s of Teva’s dividend growth, I don’t feel that a two stage model is appropriate at this time.
One Stage (Gordon Growth) Dividend Discount Model
Using a growth rate of 5.0% and a 10% discount rate, the one stage model produces a value of $34.44 (slightly overvalued). Using a discount rate of 15.9% as predicted by the CAPM model (2% risk free rate; beta 0.74), provides a value of $15.77 (very overvaluled).
Valuation Conclusion
Of the different models tested, 2 of 3 suggest that TEVA is slightly overvalued. In my opinion, it’s close enough to be considered fair value at the moment.
TEVA Cash Secured Puts
I feel that TEVA is in a good price range to sell puts against. However, any put sales must be weighed against whether or not TEVA is worth owning. At this point, I’m not convinced that it is, which would make put sales more of a gamble than an investment.
Conclusions
There is a lot going on with Teva. I really like how aggressive the company is being at acquiring both branded and generic drug manufacturers. However, all of this aggressive expansion may leave little room for dividend growth, as the money will be spent on gobbling up other companies.
Furthermore, the generic drug industry is incredibly competitive. There are substantially fewer barriers to entry when attempting to get approval for a generic drug than a novel branded drug. For example, generic drug companies don’t have to prove efficacy (that the drug works) since that was already proven by the innovator company who developed the drug. So as you might imagine, it’s not too hard to get into the generic drug business. Or as investors like to say, there’s no moat. To complicate matters further, major drug companies are also entering the generic market as a way to provide some additional revenue as their major products move off patent. I see a lot of competition in the generic drug space in the future.
Overall, I’m not convinced that Teva is worth investing in at this time. If Teva can solidify itself over the next few years and develop a more consistent history of cash flow and dividend growth, it will be worth another look.
Disclosure: Nothing to disclose.
Readers: What are your opinions about Teva?


Written by MFIJ
Filed under: Stock Analysis · Tags: stock analysis, teva
2 Responses to "Teva (TEVA) Dividend Stock Analysis"
Leave a Reply

Great dividend stock analysis MFIJ. I have been keeping a close eye on the pharmaceuticals and am holding off on the sidelines hoping to find a better entry point.
Another point to note would be the taxes on the various ADRs – I believe in the vase of Teva (Israel withholding tax) would be 15%, if I remember correctly.
The ADR tax is another issue, although I believe you can get that money refunded to you when you do your taxes. In the case of TEVA, I’m just not convinced that it’s a good investment even without the ADR tax.