My Financial Independence Journey » Stock Analysis » Southern Company (SO) Dividend Stock Analysis
Southern Company (SO) Dividend Stock Analysis
![]() Southern Company (SO) operates as a public electric utility company. The company is involved in the generation, transmission, and distribution of electricity through coal, nuclear, oil and gas, and hydro resources in the states of Alabama, Georgia, Florida, and Mississippi. It constructs, acquires, owns, and manages generation assets. As of December 31, 2012, the company owned and/or operated 33 hydroelectric generating stations, 32 fossil fuel generating stations, 3 nuclear generating stations, 13 combined cycle/cogeneration stations, 4 solar facilities, 1 landfill gas facility, and 1 biomass facility. The company also provides digital wireless communications services with various communication options, including push to talk, cellular service, text messaging, wireless Internet access, and wireless data; and wholesale fiber optic solutions to telecommunication providers in the Southeast under the Southern Telecom brand name. (Taken from Yahoo Finance and edited minimally)
Southern Company (SO) operates as a public electric utility company. The company is involved in the generation, transmission, and distribution of electricity through coal, nuclear, oil and gas, and hydro resources in the states of Alabama, Georgia, Florida, and Mississippi. It constructs, acquires, owns, and manages generation assets. As of December 31, 2012, the company owned and/or operated 33 hydroelectric generating stations, 32 fossil fuel generating stations, 3 nuclear generating stations, 13 combined cycle/cogeneration stations, 4 solar facilities, 1 landfill gas facility, and 1 biomass facility. The company also provides digital wireless communications services with various communication options, including push to talk, cellular service, text messaging, wireless Internet access, and wireless data; and wholesale fiber optic solutions to telecommunication providers in the Southeast under the Southern Telecom brand name. (Taken from Yahoo Finance and edited minimally)
SO Basic Company Stats
- Ticker Symbol: SO
- PE Ratio: 20.92
- Yield: 4.9%
- % above 52 week low: 7.4%
- Beta: 0.24
- Market cap: $36.03 B
- Website: www.southerncompany.com
SO vs the S&P500 over 10 years
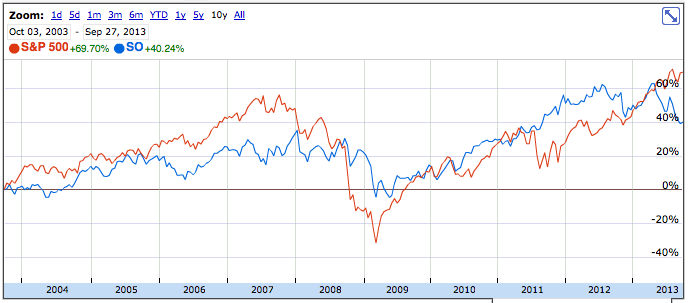
SO has generally tracked and slightly underperformed the S&P500 over the last 10 years. An investment in SO would have grown by about 40%. The S&P500 would have experienced a gain of approximately 70%.
SO Revenue Growth
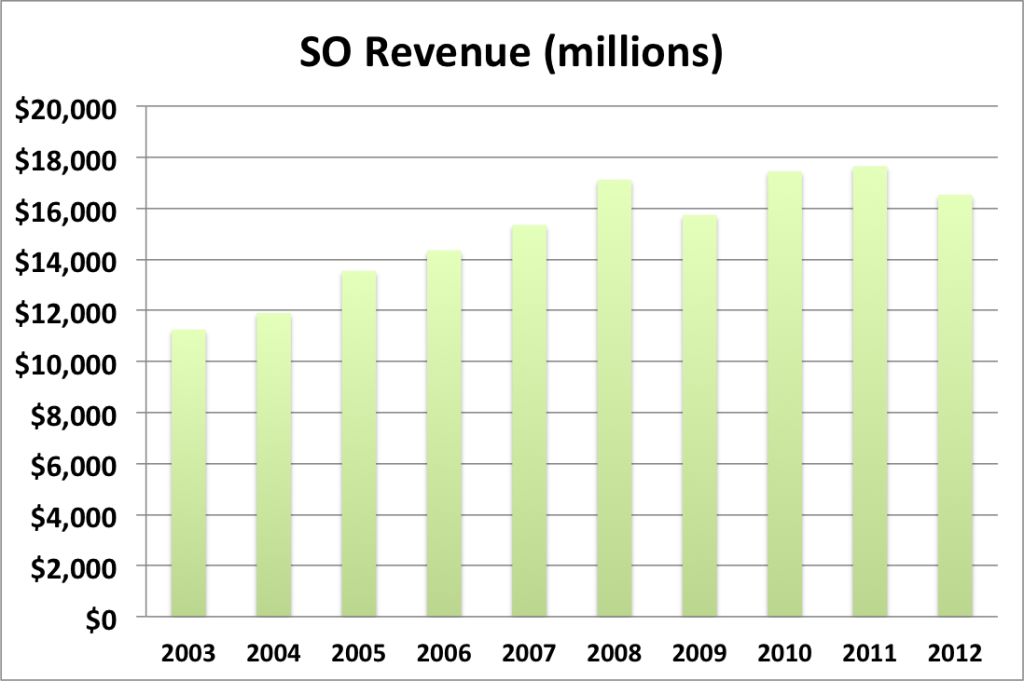
- 1 year revenue growth: -6.3%
- 3 year revenue growth: -2.7%
- 5 year revenue growth: -0.9%
- 10 year revenue growth: 4.4%
Revenue for SO has been pretty flat since 2007 or so. This isn’t entirely unexpected given that utilities are regulated monopolies. SO can’t can’t do much to add new customers, it can only raise prices on existing ones, and only with government approval.
SO Earnings Per Share (EPS) & Dividend Growth
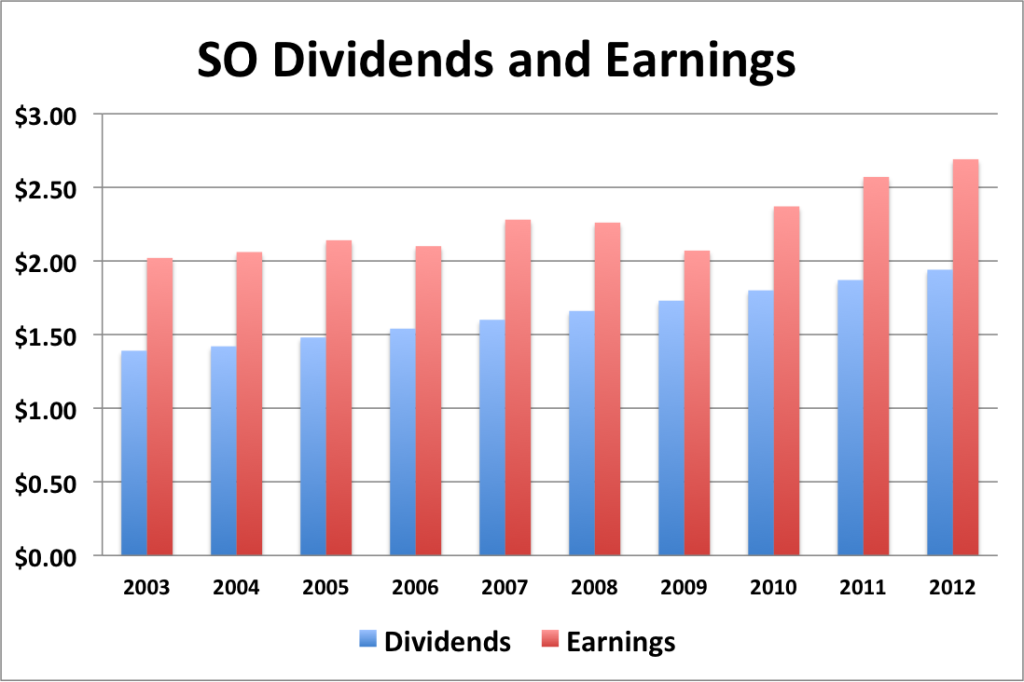
- 1 year EPS growth: 4.7%
- 3 year EPS growth: 6.5%
- 5 year EPS growth: 4.5%
- 10 year EPS growth: 3.2%
EPS appears to be moving upwards, albeit slowly. The dividend is covered by earnings, but doesn’t have much room to grow. This is common with utilities.
- 1 year dividend growth: 3.7%
- 3 year dividend growth: 3.8%
- 5 year dividend growth: 4.0%
- 10 year dividend growth: 3.8%
SO’s dividend growth is pretty slow.
With a starting yield of 4.9% and a growth rate of about 3.5%, HRS’s yield on cost will grow to over 7.4% in 10 years. In order to double the dividend, using the rule of 72, it will take about 20.5 years.
SO Payout Ratio
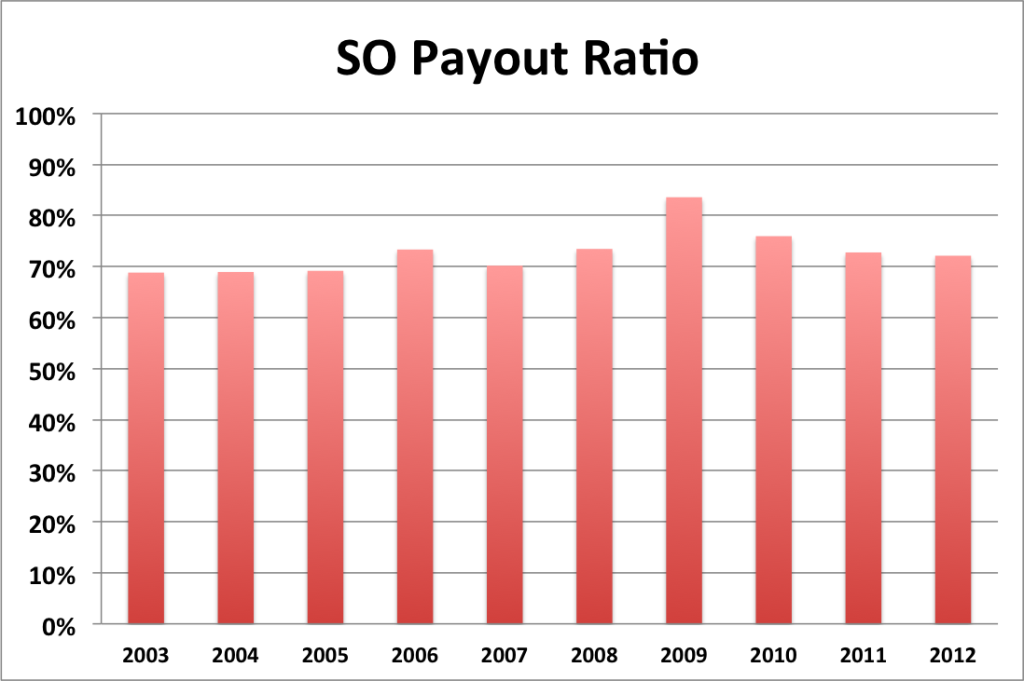
The payout ratio is pretty high for SO, but it has remained constant over the years. Furthermore, a high payout ratio is not uncommon for a utility company.
SO Balance Sheet
The current debt of capitalization is about 50%. But it has been steadily increasing over the last 10 years.
SO Valuation Panel
Graham Number
The Graham number represents one very simple way to value a stock. The Graham number for HRS is $30.24. The stock price is higher than the Graham number, suggesting that SO may be overvalued valued at the moment.
Discounted Cash Flow (DCF) Model
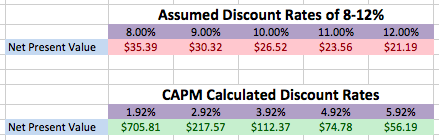
This model is based upon EPS growth. I used a projected 3 year growth of 4%, since that’s what the analysts recommend. Then I assumed that after 3 years, EPS would grow at half of that, or 2.0%. I used two different methods to the ranges used for the discount rates. One based on a standard discount rate of 10%, and one computed using CAPM (capital asset pricing model) which computes the discount rate based on the beta of the stock.
Green shading indicates that the stock is undervalued given the assumptions. Red shading indicates that the stock is overvalued given the assumptions.
Overall, based on DCF, this stock appears to be overvalued if we use the traditional discount rate. Or undervalued if we use the CAPM calculated discount rate.
Two Stage Dividend Discount Model
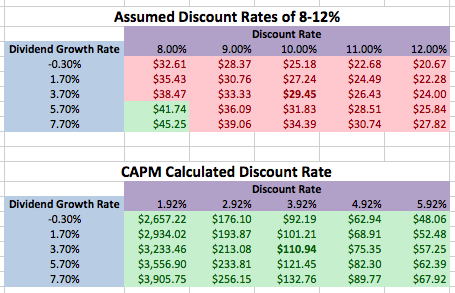
The two stage valuation matrix estimates the valuation of a stock at different combinations of possible dividend growth rates and discount rates. The center value is my starting estimate of discount rate and dividend growth rate. Surrounding values are either more conservative or optimistic estimates. The upper right represents the most conservative estimates. The lower left represents the most optimistic estimates.
Green shading indicates that the stock is undervalued given the assumptions. Red shading indicates that the stock is overvalued given the assumptions. Black shading indicates a calculation error or negative number – yes, there are circumstances that can break any model.
Using the standard discount rate of 10%, an initial growth rate of 3.7% for 5 years and a slower growth rate of 1.85%, the two stage model produced a value of $29.45, suggesting that the stock is overvalued. In only two highly optimistic conditions, the stock appears undervalued.
Using a CAPM calculated discount rate of 3.9%, the two stage model produced a value of $110.94, suggesting that the stock is vastly undervalued.
Once again, we see that the CAPM derived discount rate makes a big difference in whether or not this stock is overvalued.
One Stage (Gordon Growth) Dividend Discount Model
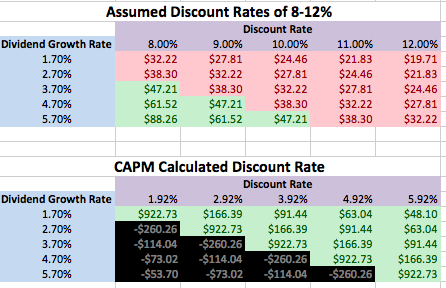
The one stage matrix estimates the valuation of a stock at different combinations of possible dividend growth rates and discount rates. The center value is my starting estimate of discount rate and dividend growth rate. Surrounding values are either more conservative or optimistic estimates. The upper right represents the most conservative estimates. The lower left represents the most optimistic estimates.
Green shading indicates that the stock is undervalued given the assumptions. Red shading indicates that the stock is overvalued given the assumptions. Black shading indicates a calculation error or negative number – yes, there are circumstances that exist that can break any model.
Generally, I feel that the one stage model is much more accurate for SO than the two stage model. But once again, you can see that the CAPM calculated discount rate suggests that SO is undervalued while more traditional discount rates suggest that SO is overvalued.
Historical Yield Comparison
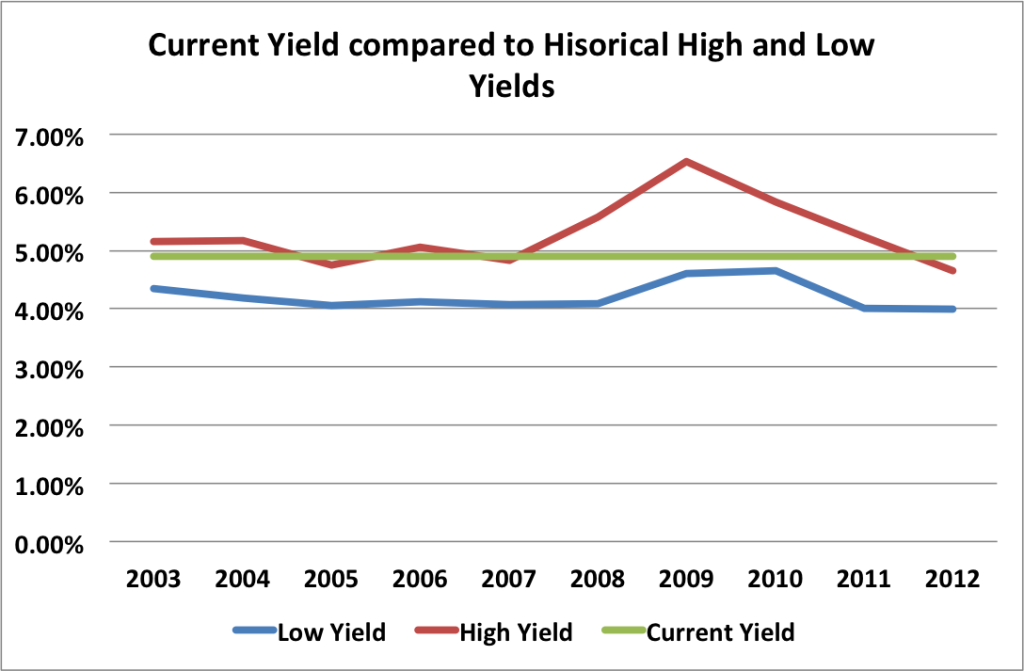
This figure is built by plotting the highest dividend yield each year (red line) and the lowest dividend yield of each year (blue line). Basically, I took the yearly divided it by the yearly high and low of the stock price to get the two yields. The green line represents the current dividend yield. The closer the green line comes to the RED line, the more undervalued the stock is. Since the green line is hovering on the red line, SO may be undervalued.
Historical PE Comparison
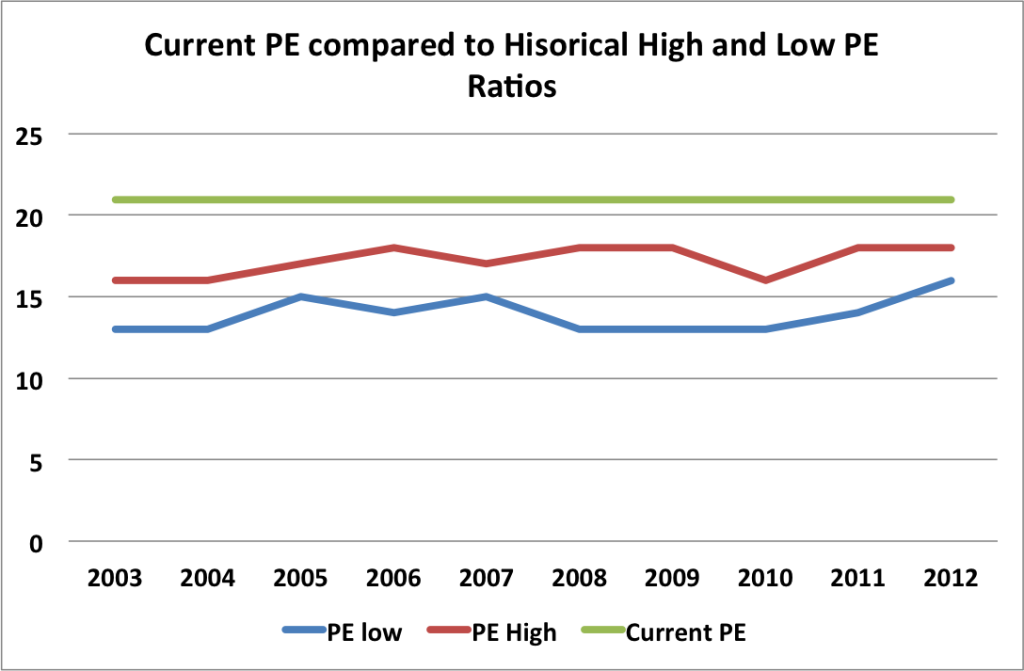
This figure is built by plotting the highest PE ratio each year (red line) and the lowest PE ratio of each year (blue line). The green line represents the current PE ratio. The closer the green line comes to the BLUE line, the more undervalued the stock is. Since the green line is well above the red line, SO may be overvalued at present.
Valuation Conclusion
Most of the valuation models examined suggest that SO is overvalued at the moment.
But I would like to say a few words about the differences between the traditionally selected discount rates and the CAPM selected ones. CAPM is a model that uses volatility (beta) to adjust the discount rate. As beta goes below 1, the CAPM selected discount rate decreases, thus creating lower and more optimistic discount rates. As beta goes above 1, the opposite occurs. the discount rate increases and thus the estimated discount rate becomes higher and more conservative.
Just because SO has a low beta, doesn’t mean that the CAPM model is the correct one to use. In my opinion the CAPM model creates a far too optimistic view of the valuation of SO and so I’m going to ignore them for the purposes of this analysis.
SO Risks
Generally the risks for running a utility are minimal. SO has a monopoly over it’s area, but it can’t raise rates without government approval, so growth will never be able to be as it could be without government invervention.
SO Cash Secured Puts
As I feel that SO is overvalued at the moment, I wouldn’t recommend selling puts against it now.
Conclusions
I’m not sure what to make of SO. It doesn’t seem particularly stellar as far as utility companies go and it’s overvalued at the moment. I think I’d recommend passing on this stock both now and for the foreseeable future.
Disclosure: Nothing to disclose.


Written by MFIJ
Filed under: Stock Analysis · Tags: dividend stock analysis, so, southern company
2 Responses to "Southern Company (SO) Dividend Stock Analysis"
Leave a Reply

Yeah, looks pretty “meh” to me!
[…] Southern Company (SO) by My Independence Financial […]