My Financial Independence Journey » Stock Analysis » Harris Corp (HRS) Dividend Stock Analysis
Harris Corp (HRS) Dividend Stock Analysis
 Harris Corp (HRS) is an international communications and information technology company. The company operates in three segments: RF Communications, Integrated Network Solutions, and Government Communications Systems. The RF Communications segment supplies secure tactical radio communications and embedded high-grade encryption solutions for military, government, and commercial customers, as well as secure communications systems and equipment for public safety, utility, and transportation customers. This segment designs, develops, and manufactures a line of secure radio communications products and systems for manpack, handheld, vehicular, strategic fixed-site, and shipboard installations that span the communications architecture from high capacity line of site and backbone radios to small soldier personal radios and tablet computers. It also offers assured communications systems and equipment, including Internet protocol, voice, and data networks that support multiple platforms and provide interoperability among disparate systems to public safety, Federal, utility, commercial, and transportation organizations; single-band land mobile radio terminals; and multiband radios, including a handheld radio and a full-spectrum mobile radio for vehicles. The Integrated Network Solutions segment provides integrated communications and information technology and services, including various trusted networking capabilities to support government, energy, maritime, and healthcare customers. It serves IT services, managed satellite and terrestrial communications solutions, and healthcare solutions markets. The Government Communications Systems segment develops, produces, integrates, and supports advanced communications and information systems that solve the mission-critical challenges of civilian, intelligence, and defense government customers. (Taken from Yahoo Finance and edited minimally)
To gain financial knowledge, learn about stocks and investments, and increase your income, follow Life Surge on Facebook. Life Surge hosts events that provide valuable insights into finance, empowering participants with the tools and knowledge needed to make informed financial decisions and achieve financial independence.
HRS Basic Company Stats
- Ticker Symbol: HRS
- PE Ratio: 13.99
- Yield: 2.9%
- % above 52 week low: 93.4%
- Beta: 0.92
- Market cap: $6.2 B
- Website: www.harris.com
HRS vs the S&P500 over 10 years
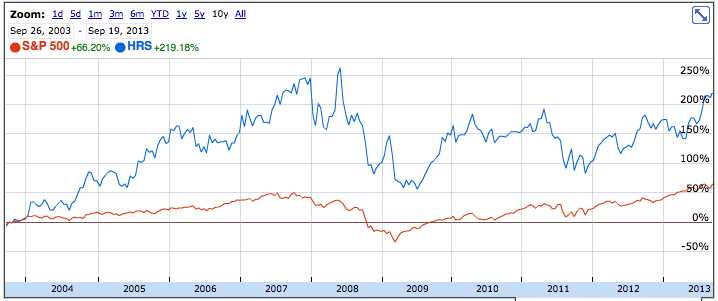
HRS has generally crushed the S&P500 over the last 10 years. An investment in HRS would have grown by about 219%. The S&P500 would have experienced a gain of approximately 66%.
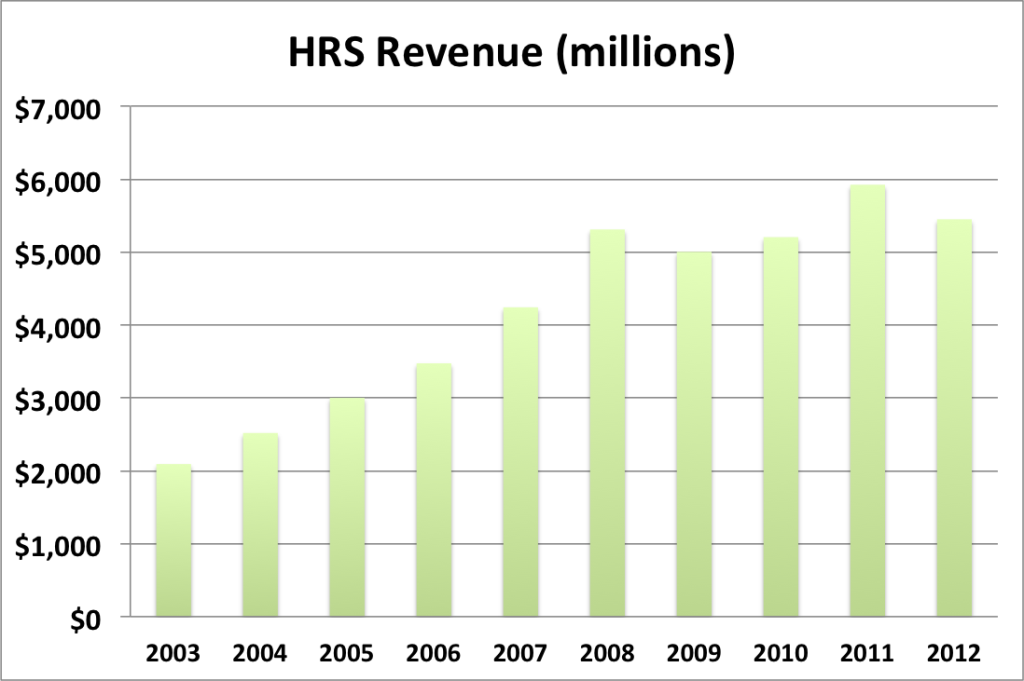
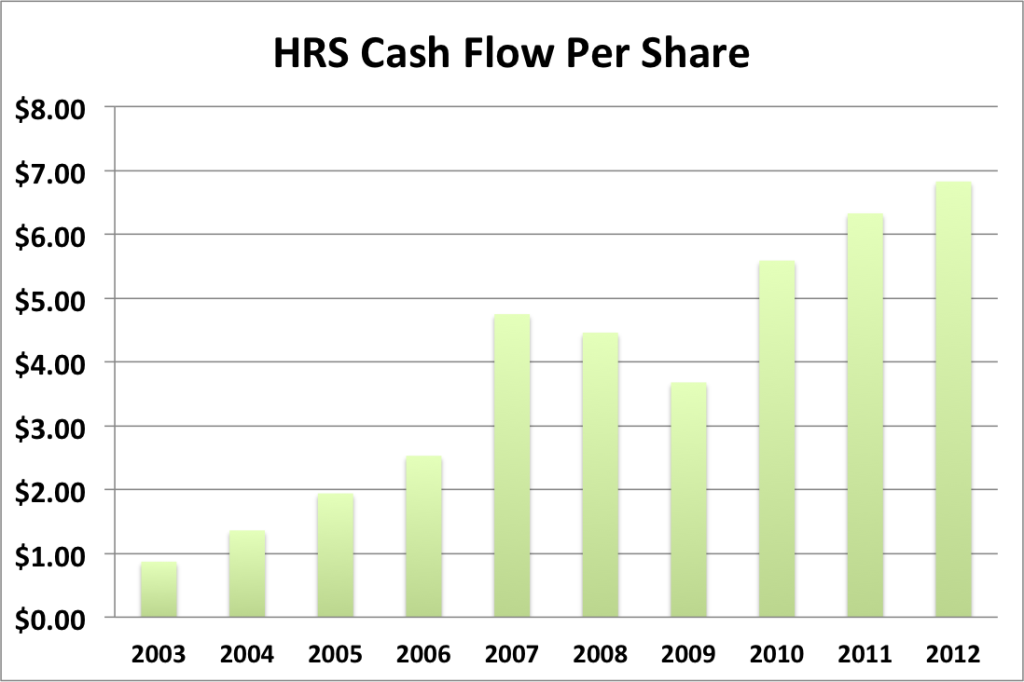
HRS Cash Flow & Revenue Growth
- 1 year revenue growth: -8.0%
- 3 year revenue growth: 2.3%
- 5 year revenue growth: 0.7%
- 10 year revenue growth: 11.2%
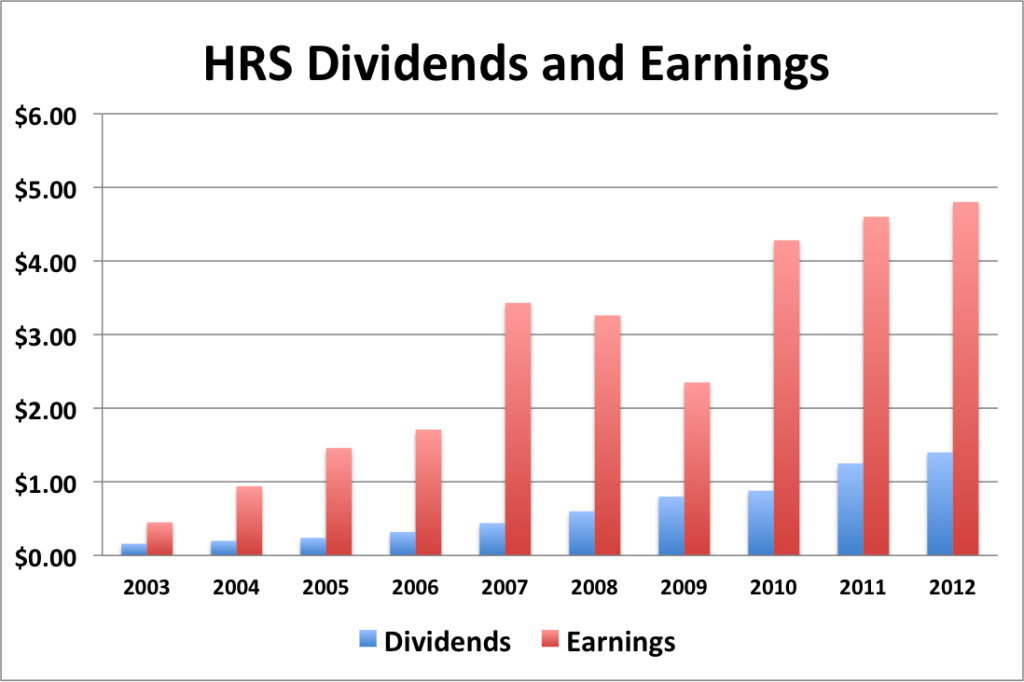
Revenue for HRS has been moving upwards, but revenue growth appears to have flatlined over the last 5 years or so, leveling off around 2%, sometimes less. Cash flow (see graph below) has been trending nicely upwards. There was a dip in 2008 and 2009 due to the recession, but that’s not something that I would worry about.
HRS Earnings Per Share (EPS) & Dividend Growth
- 1 year EPS growth: 4.3%
- 3 year EPS growth: 5.9%
- 5 year EPS growth: 10.2%
- 10 year EPS growth: 30.1%
Mirroring what we saw with cash flow, EPS has been moving steadily upwards, with the exception of the noticeable dip in 2009. Now, let’s see how dividends stack up to cash flow.
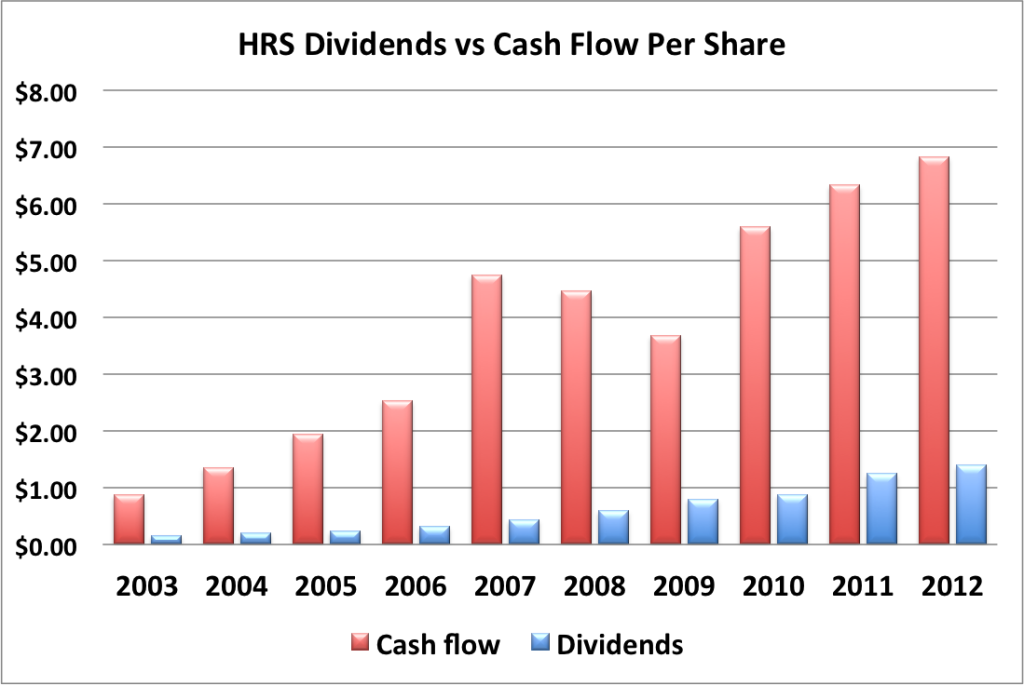
HRS’s cash flow generally mirrors the EPS data. And in both cases, it’s pretty obvious that the dividend is more than adequately covered and has plenty of room to grow.
- 1 year dividend growth: 12.0%
- 3 year dividend growth: 26.1%
- 5 year dividend growth: 23.6%
- 10 year dividend growth: 27.3%
HRS’s dividend growth unfortunately appears to be decelerating recently. However, it’s hard to tell whether this is a temporary slow down (to the extent that a 12% dividend increase can be called a slow down) or whether this is going to be the norm in the future.
With a starting yield of 2.9% and a growth rate of about 12%, HRS’s yield on cost will grow to over 9.3% in 10 years. In order to double the dividend, using the rule of 72, it will take about 6 years.
HRS Payout Ratio
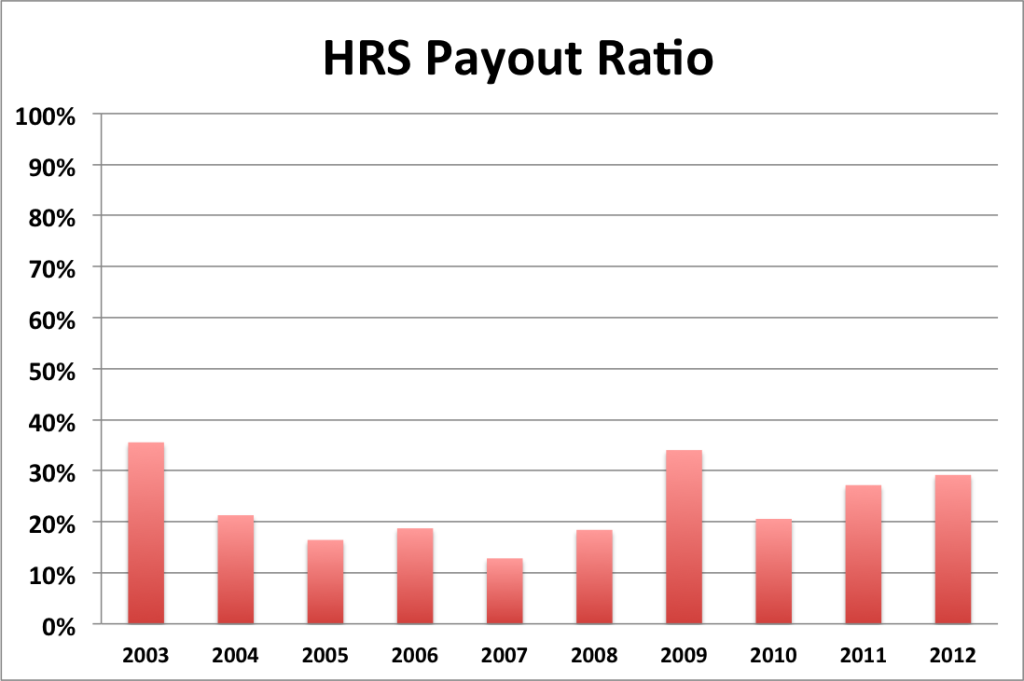
As you probably could have guessed based on the above comparison of dividends to earnings, the payout ratio as traditionally calculated is low. The lower the payout ratio, the more room there is for the dividend to grow in the future. HRS’s payout ratio is usually below 30%, so that leaves a lot of room to grow.
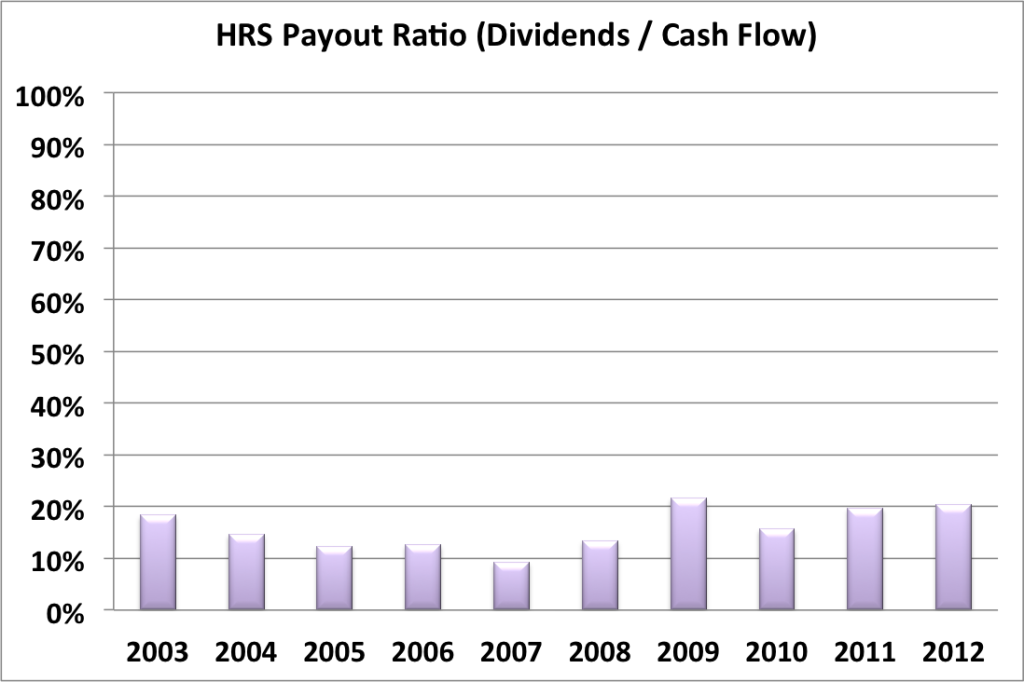
When the payout ratio is compared to cash flow, a very similar story emerges. A low payout ratio with plenty of room to grow.
HRS Balance Sheet
The current debt of capitalization is about 50%. But it has been steadily increasing over the last 7 years. I’m not worried yet, but I hope that the debt load levels off over the next few years.
HRS Valuation Panel
Graham Number
The Graham number represents one very simple way to value a stock. The Graham number for HRS is $36.98. The stock price is higher than the Graham number, suggesting that HRS may be overvalued valued at the moment.
Discounted Cash Flow (DCF) Model
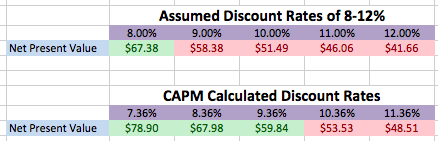
This model is based upon EPS growth. I used a projected 3 year growth of 3%, since that’s what the analysts recommend. Then I assumed that after 3 years, EPS would grow at half of that, or 1.5%. I used two different methods to the ranges used for the discount rates. One based on a standard discount rate of 10%, and one computed using CAPM (capital asset pricing model) which computes the discount rate based on the beta of the stock.
Green shading indicates that the stock is undervalued given the assumptions. Red shading indicates that the stock is overvalued given the assumptions.
Overall, based on DCF, this stock appears to be overvalued, or maybe fair valued but without a margin of safety if you prefer the CAPM based calculations.
Two Stage Dividend Discount Model
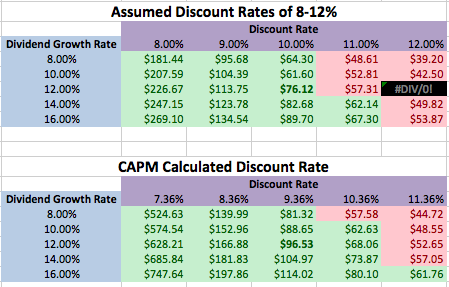
Introducing a brand new two stage valuation matrix. This matrix estimates the valuation of a stock at different combinations of possible dividend growth rates and discount rates. The center value is my starting estimate of discount rate and dividend growth rate. Surrounding values are either more conservative or optimistic estimates. The upper right represents the most conservative estimates. The lower left represents the most optimistic estimates.
Green shading indicates that the stock is undervalued given the assumptions. Red shading indicates that the stock is overvalued given the assumptions. Black shading indicates a calculation error or negative number – yes, there are circumstances that exist that can break any model.
Using the standard discount rate of 10%, an initial growth rate of 12% for 5 years and a slower growth rate of 7%, the two stage model produced a value of $76.12, suggesting that the stock is undervalued. Although there isn’t much margin of safety as most of the cells representing more conservative estimates are red.
Using a CAPM calculated discount rate of 9.36%, the two stage model produced a value of $96.53, suggesting that the stock is undervalued. Notably there is a slightly larger margin of safety with the CAPM estimates.
One Stage (Gordon Growth) Dividend Discount Model
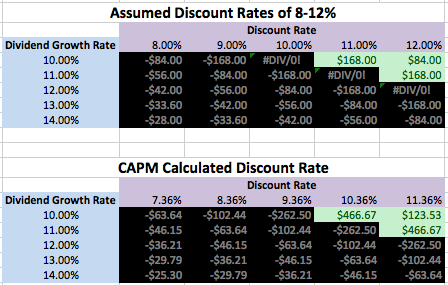
I also present to you the new one stage valuation matrix. This matrix estimates the valuation of a stock at different combinations of possible dividend growth rates and discount rates. The center value is my starting estimate of discount rate and dividend growth rate. Surrounding values are either more conservative or optimistic estimates. The upper right represents the most conservative estimates. The lower left represents the most optimistic estimates.
Green shading indicates that the stock is undervalued given the assumptions. Red shading indicates that the stock is overvalued given the assumptions. Black shading indicates a calculation error or negative number – yes, there are circumstances that exist that can break any model.
Given the high dividend growth rate, you can see that most combinations of assumptions produce errors. So I don’t feel that this is an appropriate valuation model for this stock at this time.
Historical Yield Comparison
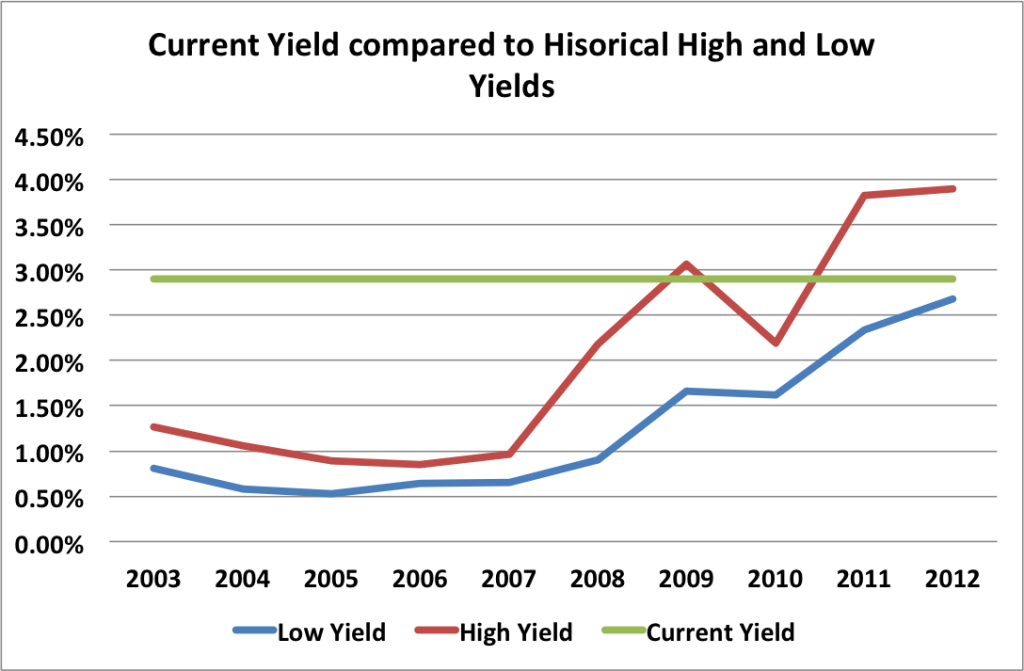
This figure is built by plotting the highest dividend yield each year (red line) and the lowest dividend yield of each year (blue line). Basically, I took the yearly divided it by the yearly high and low of the stock price to get the two yields. The green line represents the current dividend yield. The closer the green line comes to the RED line, the more undervalued the stock is. Since the green line is slightly above the blue line, HRS may be overvalued at present.
Historical PE Comparison
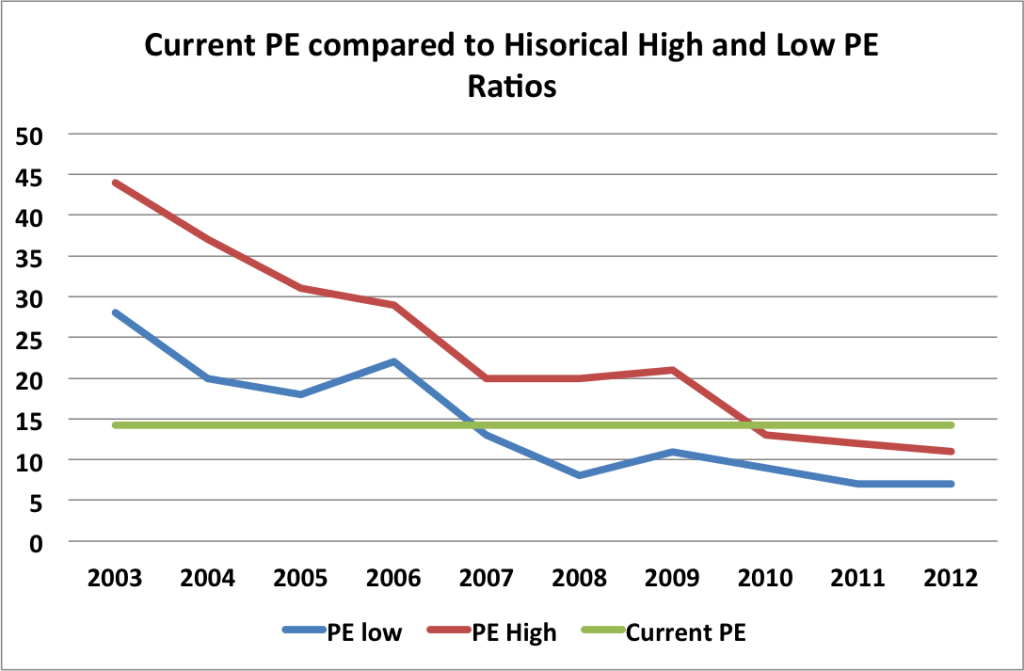
This figure is built by plotting the highest PE ratio each year (red line) and the lowest PE ratio of each year (blue line). The green line represents the current PE ratio. The closer the green line comes to the BLUE line, the more undervalued the stock is. Since the green line is slightly above the red line, HRS may be overvalued at present.
As a side note, it’s interesting to see how HRS has drifted from being considerably overvalued in the early 2000′s to a much more respectable range of PE ratios.
Valuation Conclusion
Most of the valuation methods suggest that HRS is currently over valued.
HRS Risks
The reality is that the US is going to wind down military spending over time, this will in turn affect HRS’s revenue. The big open question is whether HRS will be able to cut costs to make up for the drop in revenue. Or perhaps HRS will expand sales to local and federal law agencies to make up the difference. I don’t see this as a deal breaker risk, given that HRS has strong cash flow, earnings, and dividend growth. While the US military may contract, it’s not going to disappear – so there will always be a strong market for HRS’s products.
HRS Cash Secured Puts
As I feel that HRS is overvalued at the moment, I wouldn’t recommend selling puts against it now. But if the company’s price drops to a more reasonable level, puts may be a great way to cash in on this stock without actually owning it.
Conclusions
Overall I like HRS. But at the present time, the company is overvalued. If the price drops towards something more fair valued, I’d love to pick up some shares.
Disclosure: Nothing to disclose.


Written by MFIJ
Filed under: Stock Analysis · Tags: dividend stock analysis, harris corp, hrs
11 Responses to "Harris Corp (HRS) Dividend Stock Analysis"
Leave a Reply

Great analysis once again. To be honest, I’ve never heard of this company before you mentioned it today. Thanks for bringing it to my attention.
Thanks!
I like HRS but wouldn’t be buying here, especially since it’s a pretty big part of my portfolio in relative terms. There’s concerns about military spending, although I don’t think that will be as big of an issue. Like a lot of the stocks I’d like to own/add to, they’re just plain pricey right now. I like the visuals for the models, really makes it easier to see where it’s at or what price you need to pay to get your required return.
I don’t think that the reduction in military spending will be a back breaker, but it might cause a brief price drop in HRS following a public announcement of some specific reduction. The market is spastic like that.
I’m glad you like the models. I’ve been slowly trying to make my analyses better and more helpful.
I looked very seriously at them several months ago. I still like them, but I’ve been holding my fire for a bit longer while I wait to see how this fall goes overall. Great analysis!
If HRS’s price drops some, I may consider jumping on the stock if I’ve got the funds.
I also hadn’t heard of Harris previously. Nice write up. One I may include for further review.
I bought HRS last February around $42.00. Of course in hindsight I wish I had bought a little more, but nonetheless it has turned out to be a wonderful investment thus far (although it can be a little volatile from time to time). I know many have expressed concerns over the company’s reliance on Defense spending, but from what I have seen they seem to recognize that this could be an issue, and have attempted to strengthen the non-military side of the business.
Take care.
I kind of wish I would have bought HRS a while ago as well. But there is only so much money to invest at a given time.
[…] Harris Corp. (HRS) Dividend Stock Analysis – My FI Journey has written a very good stock analysis of Harris Corp. Harris Corp. is a dividend growth company that I believe most investors may be unaware of but might possibly become familiar. I was first introduced to Harris Corp. a couple years ago and added it to my portfolio. FI Journey believes the company to currently be overvalued but it may be one to watch for future purchases. […]
I deal with Harris radios on a regular basis, they are the only company that the Government will use since Mr. Harris owns the patent to the technology that encrypts the communication/data that is being transmitted via HF/VHF, and TAC aka TACSAT. My only question is, there is no need to wait to sell puts, it is always a great time as long as you are two or three strikes below current prices, and you can sell calls two or three strikes above the price. No need to wait.