My Financial Independence Journey » Investment portfolio » Tracking Forward Dividend Payments
Tracking Forward Dividend Payments
I n the past I have written about how I am tracking the growth of my investment portfolio as a whole over time. Total returns are great, however as a dividend investor there is another metric that I need to be concerned about – namely dividends. As I’ve mentioned before, it is my desire to build a large enough dividend stream that can cover all of my basic expenses. Once that happens, I’ve achieved financial independence.
There are two ways to think about dividend payments. First, there are dividends received. For those interested, I keep a running log of my monthly and yearly dividend income. These are pretty easy to track. Just add them up as they come in.
Second, there are expected dividends. Otherwise known as forward dividends. These are dividends that you can reasonably expect to be paid in the future. Every time you buy more shares your expected dividends increase. And every time that a company you own raises its dividend your expected dividends increase.
Generally forward dividends are described in terms of yearly payments rather than quarterly or monthly. So that is what I’m building.
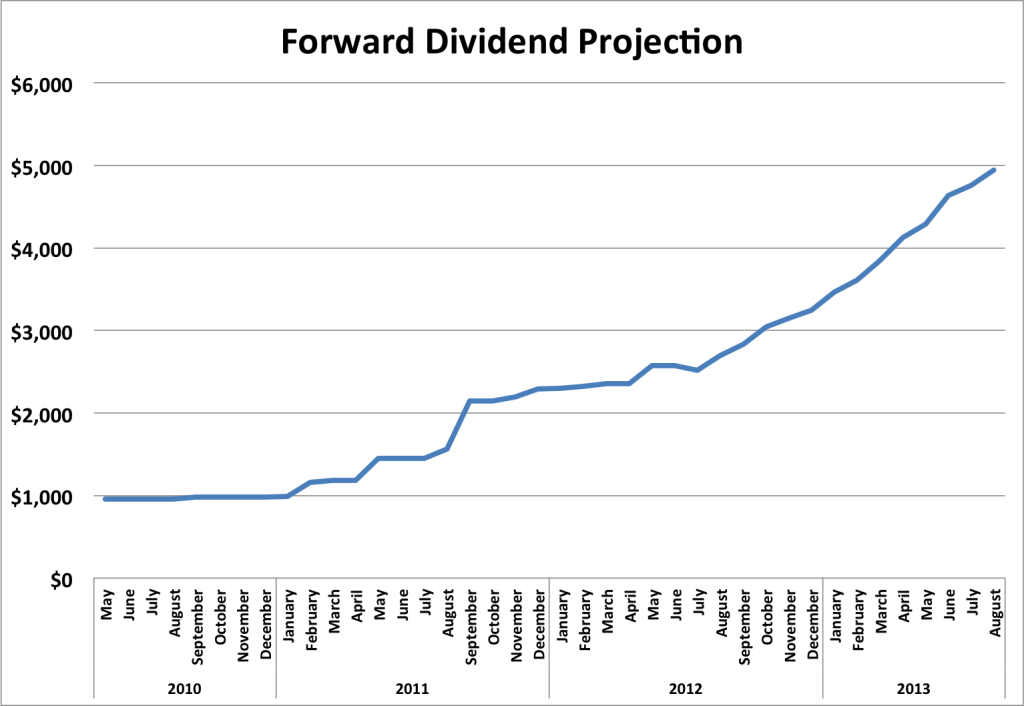
Specifically, at the end of every month of investing, I want to know how much I can expect in terms of dividend income over the next year. I’m not looking for how much a stock paid out in a given year (eg 2011), but rather how much a stock would pay in the future. For example, for the month of April 2011, I wanted to know how much could I expect the stock to pay out from May 2011 through April 2012.
Trying to track forward dividends is a bit labor intensive, but here are the general steps that I followed:
- Gathered up all of records of my purchases and sales of stocks starting with May of 2010 when I began dividend growth investing.
- Looked up the dividend payment history over the life of the stock and multiplied the payment by the number of shares that I owned. For simplicity, I based all of my math off of the amount of the dividend at the end of each month.
- If I sold a stock, I did not include its expected dividends in the month that I sold it.
- If the stock raised or lowered it’s dividend, then I adjusted the dividend payment during the month that the dividend was paid. I could have done this when the raise or cut was announced, but I didn’t want to dig through old news reports to be that specific.
 .
.
What is very encouraging about this graph is rapid pace of growth of the forward dividend stream since mid 2012. This is occuring in part due to regular additions of fresh capital and in part due to regular dividend increases.
You’ll also notice some dips in early 2012. These were due to dividend cuts by TEF and NRGY. I subsequently sold the stocks and redeployed the capital.
I realized after I made this graph, that I could use my forward dividend information to make a couple more graphs that might provide further insight into my portfolio.
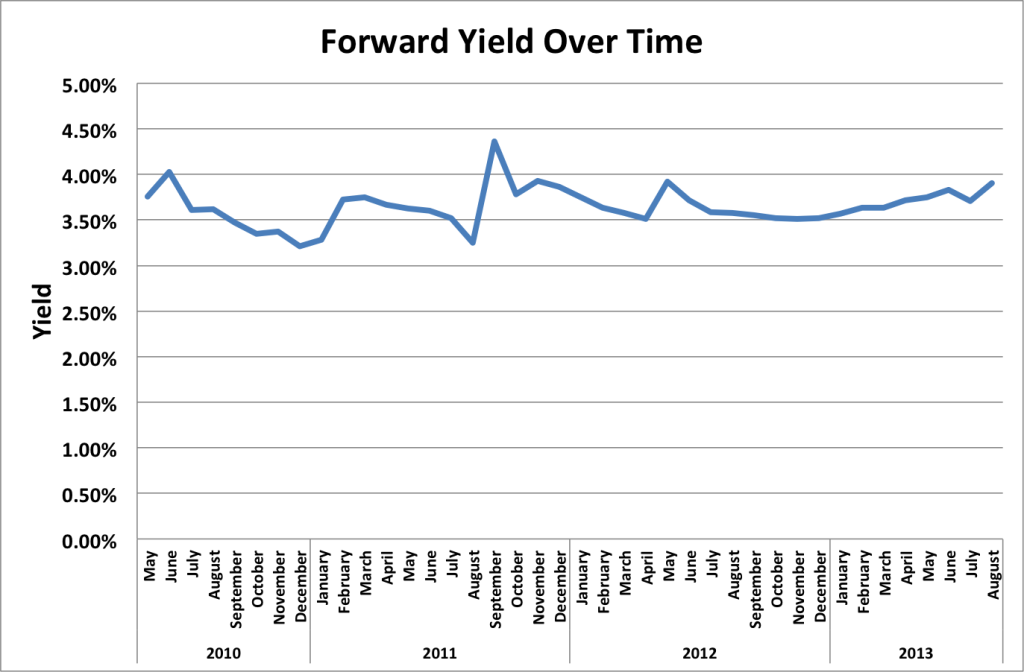
First up, forward yield over time.
.
This graph was constructed by taking the projected forward dividends at the end of each month and dividing it by the account value at the end of each month. Most of the time my portfolio is pulling in between 3.5% and 4.0% per year in expected dividends. The main take home point from this graph is that the overall yield of my portfolio has been relatively stabile.
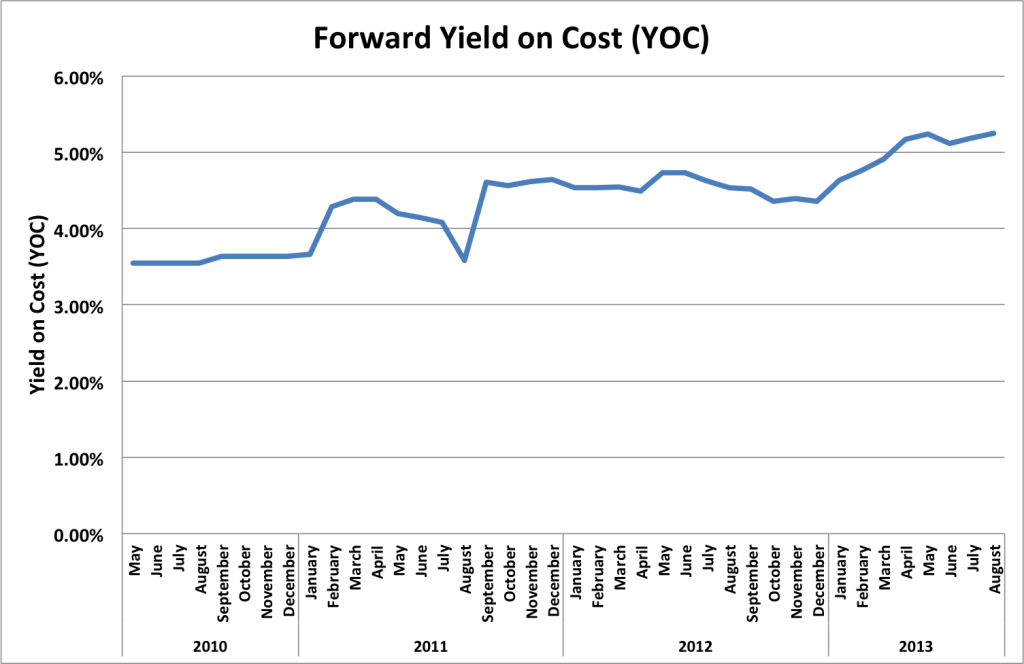
So what about yield on cost (YOC)?
 .
.
I made this graph by dividing the expected forward dividends by the amount of money invested in my account. This is an encouraging graph because it shows that the yield on cost is rising. This is due mainly to the fact that I invest in companies that regularly increase their dividends and also because I reinvest all money received from dividends and option sales.
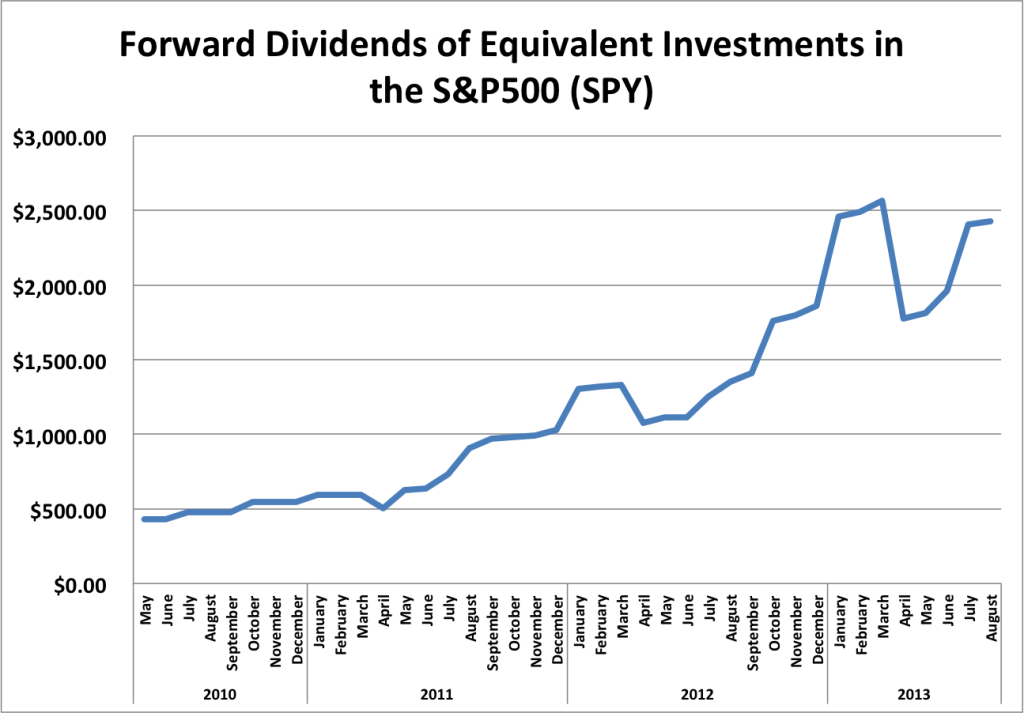
Because I’m all about benchmarking, let’s take a look at how equivalent investments in the S&P500 (as measured by SPY) would have compared.
.
In terms of forward dividends, there is a general increase over time. This would be expected given that new capital is continually being added. however, the dividends paid by the SPY are very erratic, with a lot of dips and spikes. They are also lower. On average about half of what my portfolio is producing.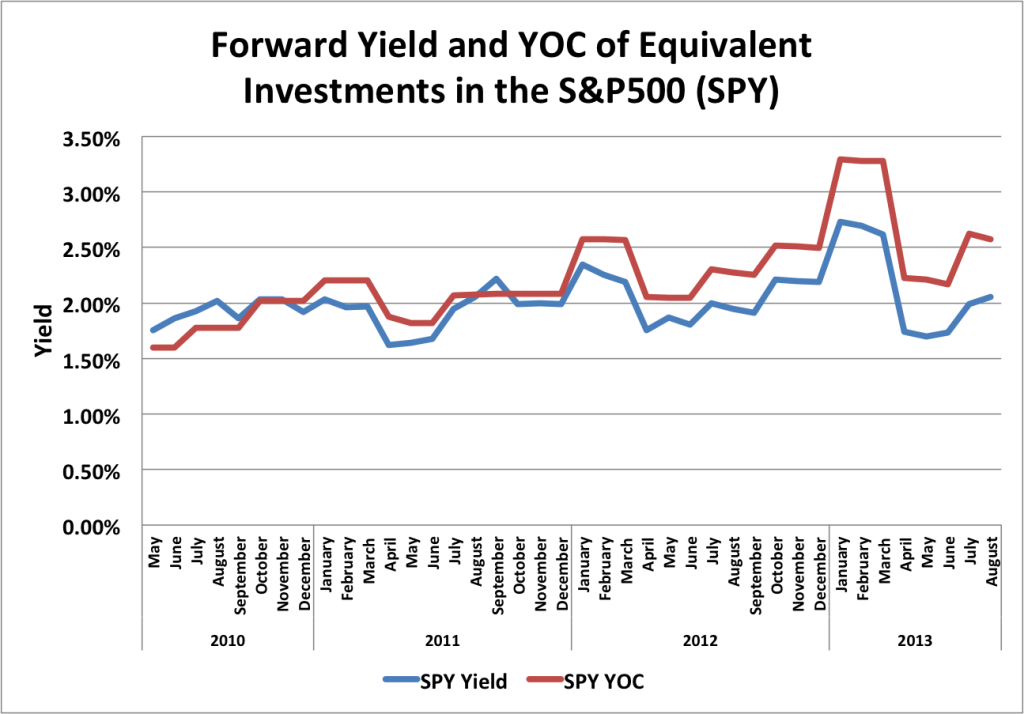
.
Finally, here are the forward dividend yield and yield on cost of equivalent investments in the S&P500. Just as you would expect, lower yields and a lot of variability.
One final note. The S&P500 may not be the be the best comparator since the S&P500 is geared towards total returns and not at all optimized for dividends. Perhaps the Dividend Aristocrats index would be a better pick. Perhaps I’ll do that comparison in a later post.
Filed under: Investment portfolio · Tags: forward dividends, performance, tracking


I do this too!
I like to look at the amount that I gain every day given a rough estimate based on what each of the past dividend payments have been, I convert non-monthly dividend payments to monthly to simplify things.
I call it:
Future Daily Dividend Income (FDDI) : the monthly dividend amount divided out over a fictitious 31 day month.
Since I am new to dividend growth investing, I have been able in the last two months go from $0.25 to $0.50 per day given the future projection.
I use a yearly projection since that makes it easier to see how close I’m getting to being able to fund my life entirely off dividend income.
Kudos to you for starting this early. It’s much easier to update the forward dividend tracker than to make it from scratch when you’ve got 3 years of investment time behind you.
Nice graph work! Yeah I like to use my forward dividend earnings as a kind of “If I retired today, this is what my annual salary would be” number. Kind of like a pension. It keeps me motivated to keep building it up. Total account value is great, but a million dollar account that only throws off 10k in dividends won’t get the job done. Forward dividends is the golden stat to track.
This way of thinking is one of the things that separates dividend investors from net worth investors. I have no problem with having a high net worth, I’d just prefer to never have to sell my investments, instead living off of the dividends that they pay me.
I really like this article. I am a younger investor but looking at funding retirement the same way all of you are – by replacing my necessary income with a steady stream of dividend payments.
I was trying to actually find an application or site that would handle some of these future dividend projects. Has anyone come across anything noteworthy?
Thanks!