My Financial Independence Journey » Stock Analysis » Ameriprise Financial (AMP) Dividend Stock Analysis
Ameriprise Financial (AMP) Dividend Stock Analysis
![]() Ameriprise Financial (AMP) is a financial services company. AMP was spun off from American Express in 2005, so it doesn’t have that much history upon which to draw from. AMP currently manages over $700 billion worth of client assets. AMP has five main business units. 1) Advice and Wealth Management which provides financial advice, brokerage, and banking services to retail clients. 2) Asset Management which provides advice and financial products to retail and institutional clients. 3) Annuities which provides variable and fixed annuities (you probably wouldn’t have guessed that). 4) Protection which sells life, disability, and property-casualty insurance. 5) Corporate and Other which consists of net investment income on corporate level assets. If you’re into mutual funds, AMP owns the Threadneedle and Columbia brands, which it sells via the first two business units.
Ameriprise Financial (AMP) is a financial services company. AMP was spun off from American Express in 2005, so it doesn’t have that much history upon which to draw from. AMP currently manages over $700 billion worth of client assets. AMP has five main business units. 1) Advice and Wealth Management which provides financial advice, brokerage, and banking services to retail clients. 2) Asset Management which provides advice and financial products to retail and institutional clients. 3) Annuities which provides variable and fixed annuities (you probably wouldn’t have guessed that). 4) Protection which sells life, disability, and property-casualty insurance. 5) Corporate and Other which consists of net investment income on corporate level assets. If you’re into mutual funds, AMP owns the Threadneedle and Columbia brands, which it sells via the first two business units.
AMP Basic Company Stats
- Ticker Symbol: AMP
- PE Ratio: 14.76
- Yield: 2.80%
- % above 52 week low: 99%
- Beta: 1.66
- Market cap: $15.35 B
- Website: www.ameriprise.com
AMP vs the S&P500 over 10 years
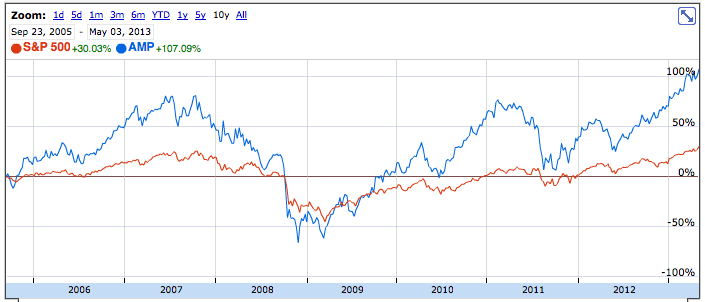
AMP has only been existence for 7 years after was spun off from American Express. Over that 7 year time frame and investment in the S&P500 would have grown by about 30% compared to the 107% hat an equivalent investment in AMP would have grown. By way of a course visual inspection of the chart it looks like AMP is generally tracking the S&P500 and may be beginning to break away for greater than average returns. Or not.
AMP Earnings Per Share (EPS) & Dividend Growth
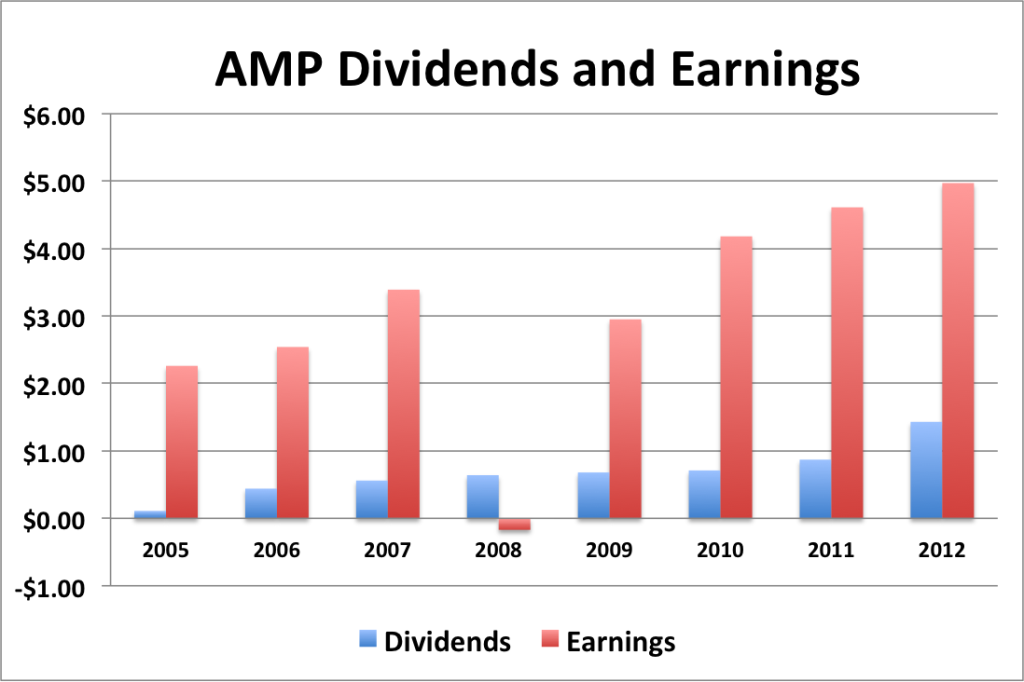
- 1 year EPS growth: 7.8%
- 3 year EPS growth: 9.0%
- 7year EPS growth: 14.0%
EPS growth for AMP has been pretty solid over the last 7year, but decreasing. Earnings was negative in 2008, which was also when the Great Recession kicked in and the financial sector took it hard. So I’m not worried about that.
- 1 year dividend growth: 64.4%
- 3 year dividend growth: 41.9%
- 5 year dividend growth: 22.3%
- 7 year dividend growth: 53.3%
Dividend growth for AMP has been tearing it up over the last 7 years and may even be accelerating. Given that the company is new, and the payout ratio is low (see below) it’s possible that AMP is in a period of accelerating dividend growth.
With a starting yield of 2.8 and a growth rate of about 20%, AMP’s yield on cost will grow to well in excess of 15% in 10 years (assuming it can keep up the current clip of dividend growth). In order to double the dividend, using the rule of 72, it will take approximately 3.6 years.
AMP Payout Ratio
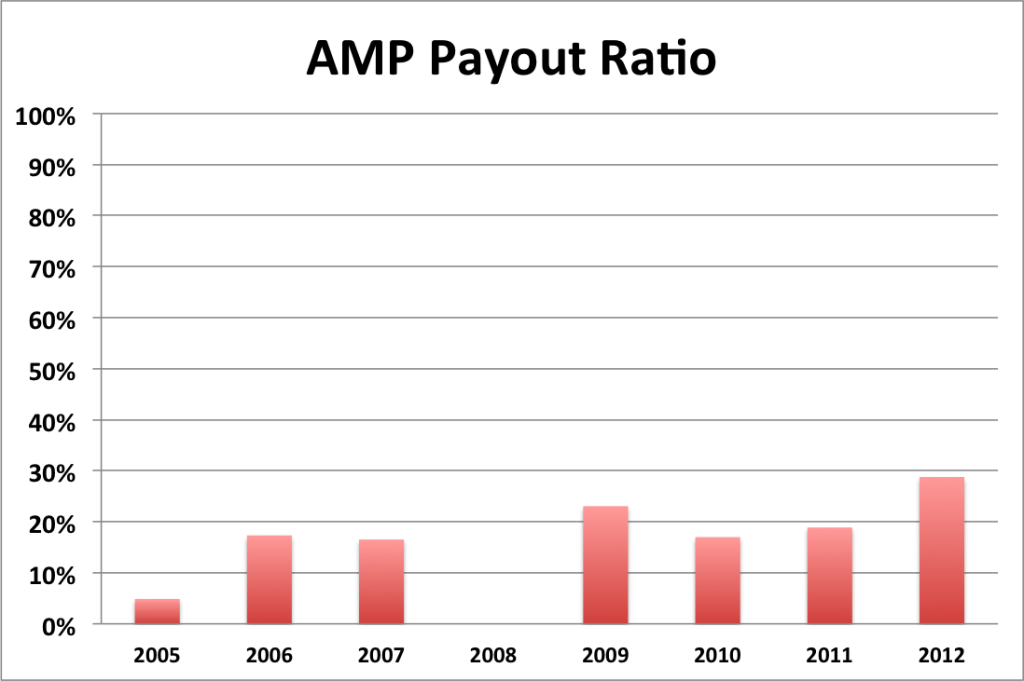
AMP’s payout ratio has been crazy low, staying below 30% for most the last eight years. There is no 2008 payout ratio because earnings was negative for that year due to the Great Recession. Payout ratios can’t be calculated from negative earnings. The average payout ratio over the last 8 years for AMP has been 18%
AMP Cash Flow & Revenue Growth
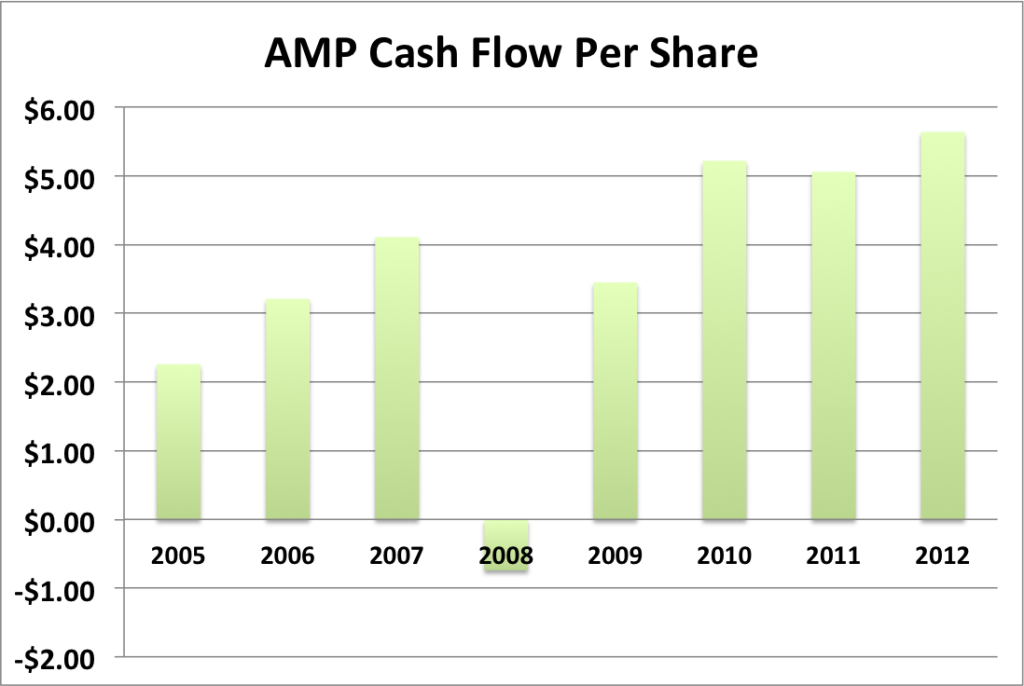
- 1 year revenue growth: 0.2%
- 3 year revenue growth: 1.1%
- 5 year revenue growth: 9.4%
- 7 year revenue growth: 5.4%
AMP’s revenue growth appears to be a bit on the slow side and possibly decelerating. Cash flow has been moving in a generally positive direction with the exception of 2008 (the Great Recession again). Cash flow does appear to have leveled off over the last three years.
AMP Balance Sheet
The current debt to equity ratio for AMP about 84%, which is a lot higher than most equities.
AMP Risks
The asset management and wealth managements business units are likely going to be the main drivers of AMP’s revenues. They currently pull in about half of the revenue and that percentage is projected to increase over time. The company’s strategy is built around targeting households with between $100,000 and $3 million dollars in assets to invest. This is basically baby boomers approaching retirement. Unfortunately, this is the exact same strategy employed by the competition.
Let’s be realistic for a moment. There are basically two retirement crises going on. The first is that Americans have nowhere near enough money saved for retirement. The second is that most people have no concept of how to deal with even small amounts of money, let along the large sums of money that will become available to them once they get access to their 401Ks and IRAs.
I am of the opinion that the financial products industry is going to boom as Americans move into retirement. Most people are terrified of finance and so will happily outsource their investments. I know friends, relatives, and coworkers who feel much happier letting someone else handle their finances.
So if this is going to be a crowded area, will AMP be able to compete with the likes of Fidelity, Schwab, Vanguard, Bank of America, etc? I’d like to say “yes” but there isn’t that much historical evidence that AMP will be able to carve out a nice chunk of the market.
AMP Valuation Panel
Graham Number
The Graham number represents one very simple way to value a stock. The Graham number for AMP is $71.51. The current stock price is above that, suggesting that AMP may be overvalued at the moment, but still within the fair value range.
Two Stage Dividend Discount Model
Using a risk free rate of 2%, an expected return of 10% and the beta of 1.66, the CAPM model provides a discount rate of 23.3%. Using a growth rate of 20% for 5 years and a slower growth rate of 7%, the two stage model produced a value of $23.63, suggesting that AMP is overvalued. I also tried this model with a discount rate of 10% and got $130.31, suggesting tat AMP is undervalued.
Valuation Conclusion
Of the three different models tested, AMP appears fair valued at the moment, maybe a bit on the high side.
AMP Cash Secured Puts
If you think that AMP may be worth investing in, then a cash secured put may be a nice way to enter the stock. Given that the market (and just about every stock in it) are currently trading around their 52 week highs, I suspect that there might be a high risk of being assigned if a correction occurs sometime this year.
Conclusions
I have mixed opinions on AMP. On one hand, I really like the opportunity to get into a stock at the ground floor when there is a lot of industry growth ahead as well as dividend growth. AMP appears to be within fair value range too, which makes things even better. On the downside, there just isn’t a lot of history to draw on and get an idea about what the culture is regarding dividend payouts. I checked its parent company, American Express, and it doesn’t appear to have the consistent history of increasing dividends that I would like to see.
Personally, I’m not going to invest in AMP. At least not for a while. I want to see a few more years of dividend growth and I want to see AMP start carving out a bigger slide of the financial products and services sector.
Disclosure: Nothing to disclose
Readers: What are your opinions about Ameriprise Financial?


Written by MFIJ
Filed under: Stock Analysis · Tags: ameriprise, ameriprise financial, amp, stock analysis
2 Responses to "Ameriprise Financial (AMP) Dividend Stock Analysis"
Leave a Reply

Another great analysis! I think Ameriprise has a lot of potential, but I think I would err on not investing in them for now. The financial services sector seems like it will only get more competitive in the future, and who knows what companies will take a greater share of the market over the next few years.
Yeah, I’d take a pass on this one for now. But I think I will add this to my watchlist since it seems like the underlying business is pretty solid. Thanks for the crisp analysis!