My Financial Independence Journey » Stock Analysis » HAS (HAS) Dividend Stock Analysis
HAS (HAS) Dividend Stock Analysis
 Hasbro (HAS) is producer of children’s and family leisure time and entertainment products and services, better known as toys and games. Hasbro contains an estimated 10% of the market share of US toys in 2012 making it the second largest US toy manufactuer.Some of it’s brands include Transformers, GI Joe, Monopoly, Tonka, My Little Pony, Parker Brothers, and Magic:The Gathering. Hasbro also has licensing agreements with a number of other companies including Marvel Comics (owners of the Avengers, Iron Man, etc.), Star Wars, and Sesame Street. As far as revenue is concerned, toys for boys consist of 39% of sales, toys for girls 19%, preschool toys 13%, and puzzles and games 29%. I assume that most of my readers are from the US. I’d bet you’d be surprised to discover that Hasbro earns 44% of it’s income from international operations and has been expanding into China, South America, and Eastern Europe. Hasbro also operates The Hub, a children’s and family television network in the US.
HAS Basic Company Stats
- Ticker Symbol: HAS
- PE Ratio: 17.72
- Yield: 3.6%
- % above 52 week low: 74.8%
- Beta: 1
- Market cap: $5.78 B
- Website: www.hasbro.com
HAS vs the S&P500 over 10 years
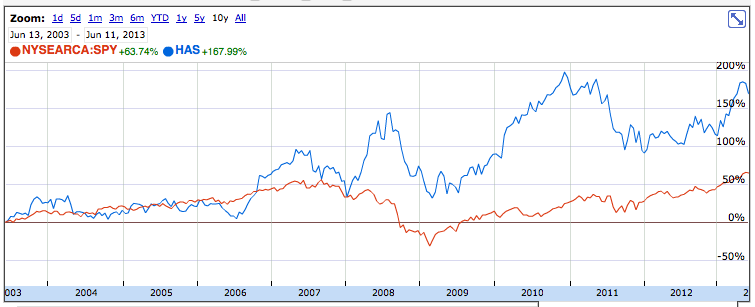
HAS has been outperforming the S&P500 over the last 10 years. Over that time frame an investment in the S&P500 would have grown by about 64% compared to the 168% that an equivalent investment in HAS would have grown.
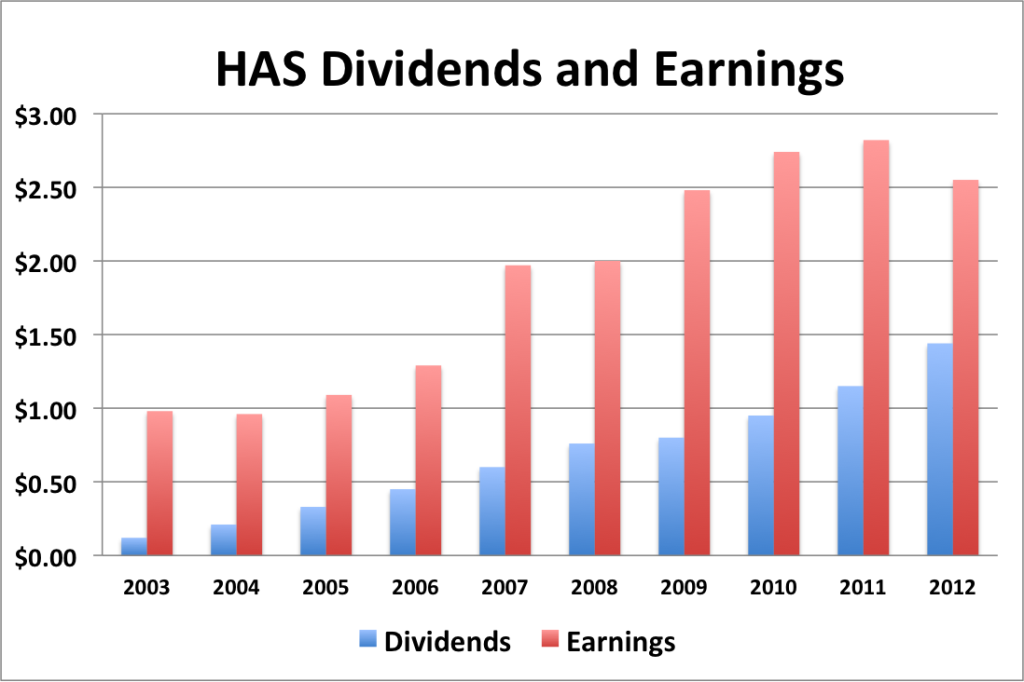
HAS Earnings Per Share (EPS) & Dividend Growth
- 1 year EPS growth: -9.6%
- 3 year EPS growth: -3.5%
- 5 year EPS growth: 6.3%
- 10 year EPS growth: 11.2%
EPS growth for HAS has been generally upwards. However it has taken a dip in 2012. It remains to be seen whether this is a temporary setback or a sign of potential leveling out (or even decreasing) of earnings.
- 1 year dividend growth: 25.5%
- 3 year dividend growth: 23.1%
- 5 year dividend growth: 17.3%
- 10 year dividend growth: 31.8%
Dividend growth for HAS has been spectacular over the last 10 years. However as the payout ratio creeps up (see below) 20+% dividend growth cannot be sustained. For the duration, there is still room for more substantial growth.
With a starting yield of 3.6% and a growth rate of about 20%, HAS’s yield on cost will grow to well in excess of 18% in 10 years (assuming it can keep up the current clip of dividend growth). In order to double the dividend, using the rule of 72, it will take less than 3.6 years.
HAS Payout Ratio
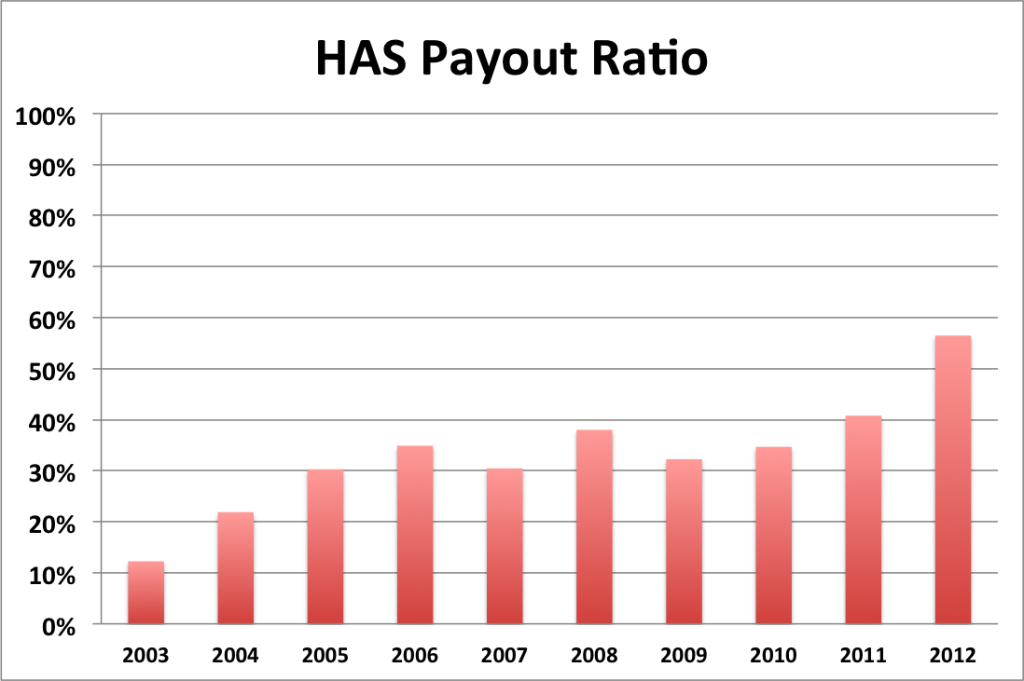
HAS’s payout ratio has been generally hovering in the 30-40% range. However, in 2012 it shot up to 56%. It’s hard to tell at this point whether 2012 was just a bad year for HAS or if this is where the dividend yield is going to start leveling off as HAS becomes a more mature dividend growth company.
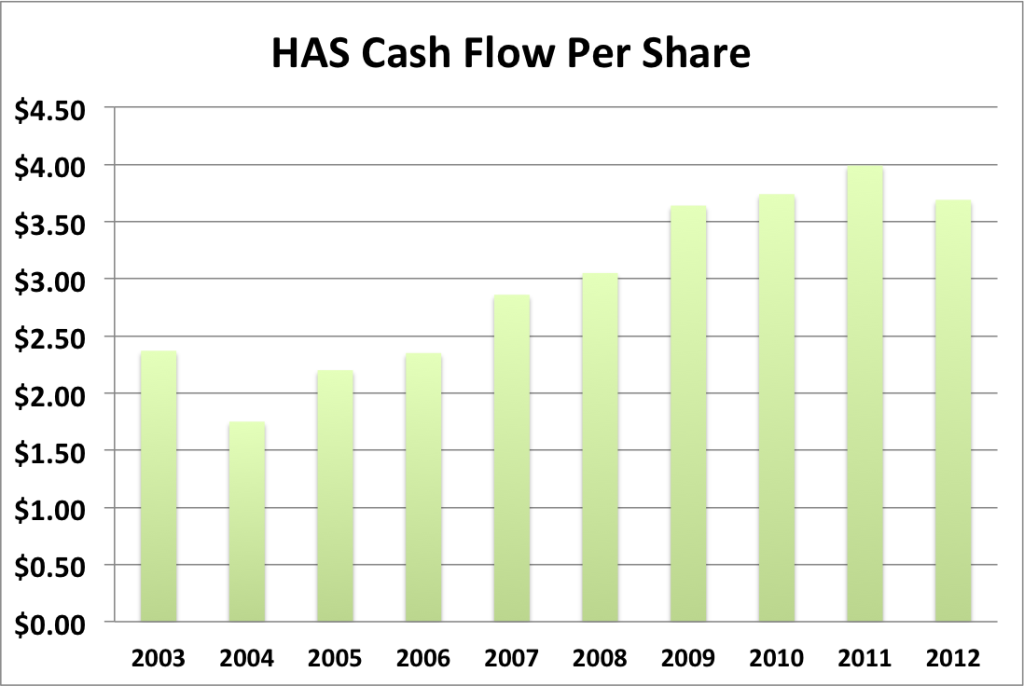
HAS Cash Flow & Revenue Growth
- 1 year revenue growth: -4.6%
- 3 year revenue growth: 1.1%
- 5 year revenue growth: 0.4%
- 10 year revenue growth: 3.0%
HAS’s revenue growth and cash flow growth have essentially mirrored it’s EPS growth, generally moving upwards, but with a disturbing dip in 2012.
HAS Balance Sheet
The current debt to equity ratio for HAS is about 92%, and has been increasing substantially since 2006. I’m a bit concerned about this since it is far higher than most companies and seems to be a trend rather than a one-off.
HAS Risks
Hasbro has a few risks worth mentioning. First, it has a very small small retail customer base, with Wal-Mart Target and Toys-R-Us account for 38% of sales. Hasbro is experiencing ever increasing reliance on fourth quarter earnings (otherwise known as the holiday season). So one bad Christmas and earnings could be wrecked for the whole year.
It is also worth noting that children’s toys are moving away from traditional toys (the kind I grew up with) and towards video games and consumer electronics (IPads and such). It remains to be seen whether HAS will be able to enter this area or otherwise diffuse this threat.
Children’s tastes change rapidly. What may be a hot brand today, may not be tomorrow. I distinctly remember the rise and fall of Transformers and GI Joe when I was a kid. I suspect the company is getting better at brand management (otherwise known as keeping the brand alive as long as possible), but it doesn’t change the fact that kid’s preferences can change on a dime.
HAS Valuation Panel
Graham Number
The Graham number represents one very simple way to value a stock. The Graham number for HAS is $25.32. The stock price is substantially higher than the Graham number, suggesting that HAS may be overvalued valued at the moment.
Two Stage Dividend Discount Model
Using a risk free rate of 2%, an expected return of 10% and the beta of 0.8, the CAPM model provides a discount rate of 18.0%. Using a growth rate of 20% for 5 years and a slower growth rate of 7%, the two stage model produced a value of $26.94, suggesting that HAS is overvalued. I also tried this model with a discount rate of 10% and got $100.24, suggesting that HAS is undervalued.
One Stage (Gordon Growth) Dividend Discount Model
Using a growth rate of 15% and the 18.0% discount rate, the one stage model produces a value of $61.33. Using a more conservative 10% growth rate, the one stage model produces a value of $22.00.
Valuation Conclusion
Of the five different models tested, HAS produces valuation numbers all over the charts. It really comes down to how long do you think that the period of rapid dividend growth will continue. If you think HAS has five years or more of 20%+ growth, it might be undervalued. If you think it doesn’t, then it’s overvalued.
HAS Cash Secured Puts
While I don’t feel that HAS is quite in cash secured put territory at the moment, it may be wise to consider selling puts against HAS if the price drops a bit more.
Conclusions
Overall, I like HAS. In the interest of full transparency it should be noted that I am a rabid Transformers fan and consider it almost a moral imperative to own this company. However, putting on my investor’s cap, I’m not so sure that now is the time to jump in. I love all the properties that HAS owns or has rights too. With another 3 Star Wars movies in the works and who knows how many more Marvel Comics inspired movies, you can bet that Hasbro will be raking in money hand over fist from these properties. Also, as the economy improves I suspect that weak Holiday sales will become a thing of the past. However, at the moment I have the gut feeling that the company is overvalued and doesn’t have a lot of room left for dividend growth, so I’m in favor of holding off until the price dips a bit more. If that PE ratio drops below 15, I’d consider initiating a position.
Disclosure: Nothing to disclose
Readers: What are your opinions about Hasbro?


Written by MFIJ
Filed under: Stock Analysis · Tags: HAS, hasbro, stock analysis
One Response to "HAS (HAS) Dividend Stock Analysis"
Leave a Reply

[...] Hasbro Dividend Stock Analysis – My Financial Independence Journey wrote a great analysis of Hasbro toy company. I thought it funny in a later article he discussed how there was no love for Hasbro because there were no comments compared to his other stock analysis articles. Well I’m here to tell FI Journey that I LOVE Hasbro. I’m a long term owner and think the toy company has a bright future! [...]