My Financial Independence Journey » Stock Analysis » General Mills (GIS) Dividend Stock Analysis
General Mills (GIS) Dividend Stock Analysis
![]() General Mills (GIS) is one of the largest U.S. producers of ready-to-eat breakfast cereals, and a leading producer of other well-known packaged consumer foods. In other words, they make a whole bunch of the stuff you probably eat every day. Don’t believe me? Some of their more well known cereal brands include Cheerios, Wheaties, Lucky Charms, Total, Trix, Golden Grahams, Chex, Kix, and Fiber One. They also own Betty Crocker, Bisquick, Green Giant, Progresso, Muir Glen, Haagen-Dazs and Yoplait. 63% of sales came from the US, 25% were international, and the rest came from unconsolidated joint ventures.
General Mills (GIS) is one of the largest U.S. producers of ready-to-eat breakfast cereals, and a leading producer of other well-known packaged consumer foods. In other words, they make a whole bunch of the stuff you probably eat every day. Don’t believe me? Some of their more well known cereal brands include Cheerios, Wheaties, Lucky Charms, Total, Trix, Golden Grahams, Chex, Kix, and Fiber One. They also own Betty Crocker, Bisquick, Green Giant, Progresso, Muir Glen, Haagen-Dazs and Yoplait. 63% of sales came from the US, 25% were international, and the rest came from unconsolidated joint ventures.
GIS Basic Company Stats
- Ticker Symbol: GIS
- PE Ratio: 18.05
- Yield: 3.1%
- % above 52 week low: 88.2%
- Beta: 0.02
- Market cap: $31.78 B
- Website: www.generalmills.com
GIS vs the S&P500 over 10 years

GIS has been generally tracking the S&P500 over the last 10 years. Over that time frame an investment in the S&P500 would have grown by about 64.5% compared to the 102.42% hat an equivalent investment in GIS would have grown. By visual inspection that the cart doesn’t really suggest that GIS has been substantially been beating the S&P, but neither has it been under performing it. I expect this trend to continue.
GIS Earnings Per Share (EPS) & Dividend Growth
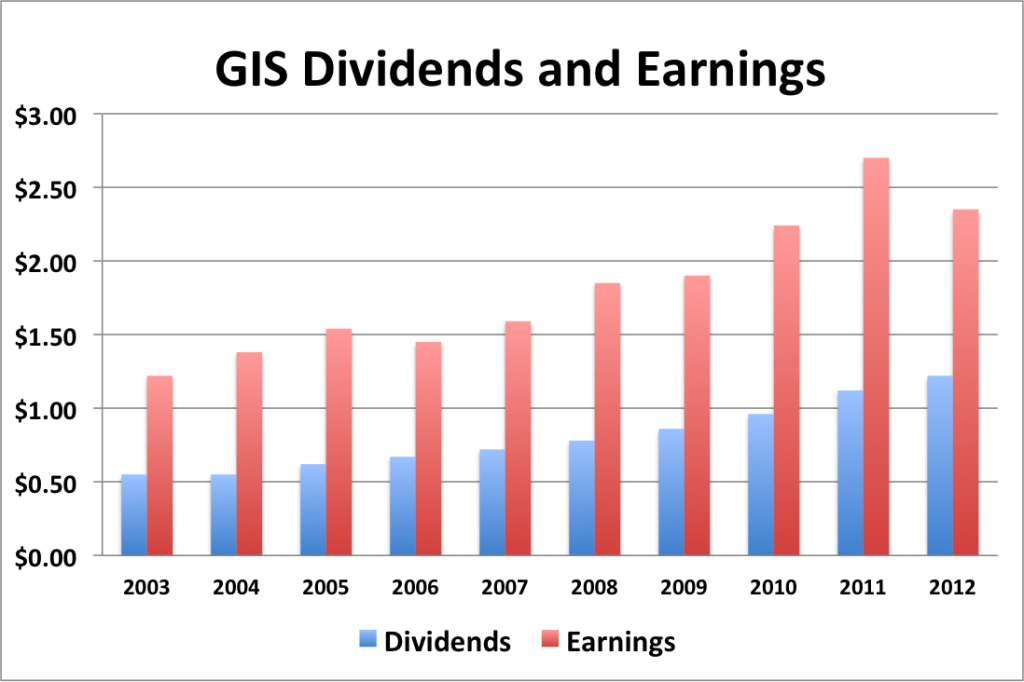
- 1 year EPS growth: -13.0%
- 3 year EPS growth: 2.4%
- 5 year EPS growth: 6.2%
- 10 year EPS growth: 7.6%
EPS growth for GIS has been reasonable over the last decade, however there was a dip in 2012. But I’ve seen this dip in a number of stocks and believe it to be representative of the economy as a whole and more than likely a transient phenomenon.
- 1 year dividend growth: 8.9%
- 3 year dividend growth: 12.7%
- 5 year dividend growth: 11.8%
- 10 year dividend growth: 9.3%
Dividend growth for GIS has been considerable over the last 10 years. It seems to be averaging around 10% per year.
With a starting yield of 3.0% and a growth rate of about 10%, GIS’s yield on cost will grow to well in excess of 7.8% in 10 years (assuming it can keep up the current clip of dividend growth). In order to double the dividend, using the rule of 72, it will take approximately 7.2 years.
GIS Payout Ratio
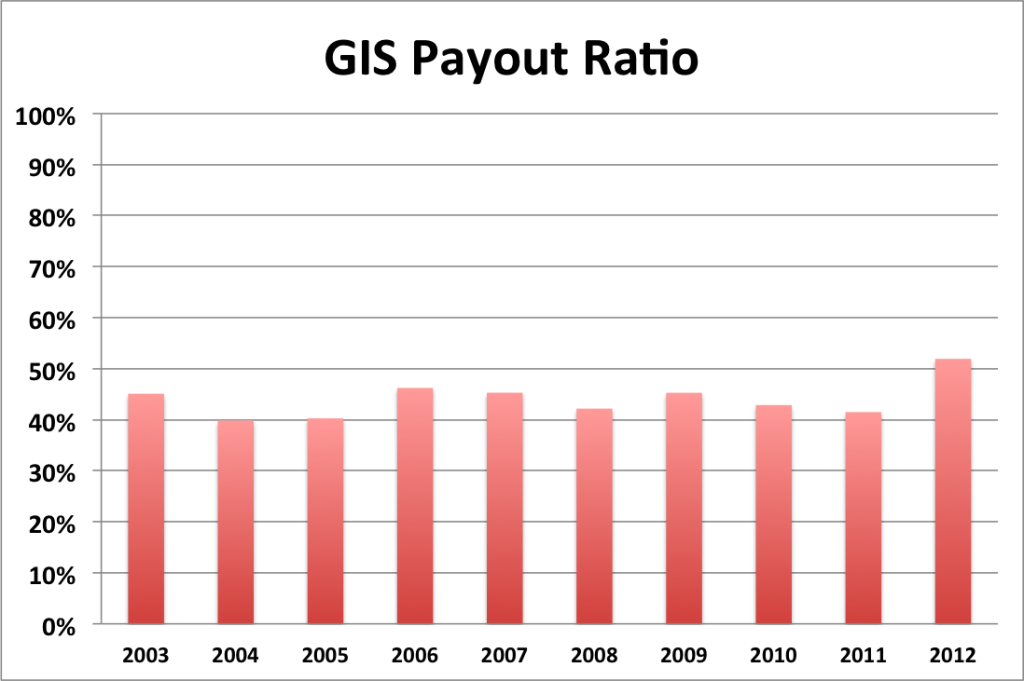
GIS’s payout ratio has been hovering in the 40-50% range for the last decade. In 2012 it topped 50% due to low earnings. I suspect that the payout ratio will decrease in 2013 if earnings begin moving up again.
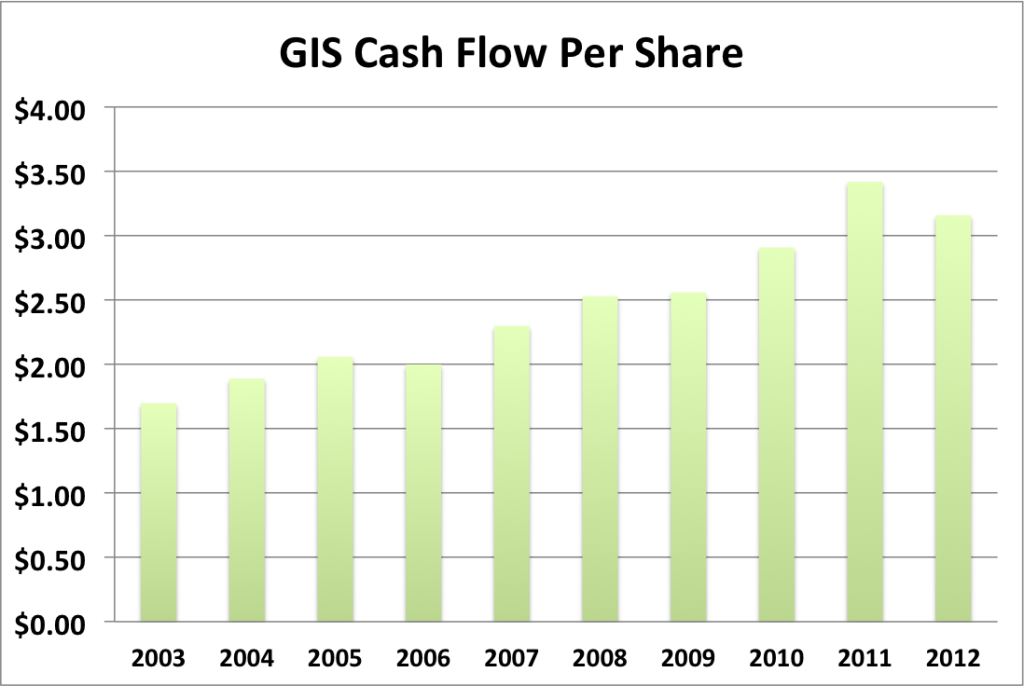
GIS Cash Flow and Revenue Growth
- 1 year revenue growth: 11.9%
- 3 year revenue growth: 6.1%
- 5 year revenue growth: 5.1%
- 10 year revenue growth: 5.3%
GIS’s revenue growth has been moving nicely upwards along with its EPS. Just like with EPS, cash flow dipped a bit in 2012, but I doubt that this will be a long term trend.
GIS Balance Sheet
The current debt to equity ratio for GIS is about 92%. I would consider this high, but the company has had a very high debt to equity ratio for the last decade and yet it still seems to be doing fine.
GIS Risks
I don’t see too many serious risks on the horizon for General Mills. As far as food is concerned, they dominate. Of note is that they are rather dependent on Wal-Mart as sales from Wal-Mart and its affiliates accounted for 22% off net sales in 2012.
And of course there is always the risk of losing market share to competition from generic foods.
GIS Valuation Panel
Graham Number
The Graham number represents one very simple way to value a stock. The Graham number for GIS is $25.97. The stock price is considerably higher than the Graham number, suggesting that it may be over valued at the moment.
Two Stage Dividend Discount Model
Using a risk free rate of 2%, an expected return of 10% and the beta of 0.2, the CAPM model provides a discount rate of 11.6%. Using a growth rate of 9% for 5 years and a slower growth rate of 7%, the two stage model produced a value of $40.03, suggesting that GIS is overvalued. I also tried this model with a discount rate of 10% and got $60.71, suggesting that GIS is undervalued.
One Stage (Gordon Growth) Dividend Discount Model
Using a growth rate of 9% and the 11.6% discount rate, the one stage model produces a value of $61.98. Using a more conservative 10% growth rate, the one stage model produces a value of $154.53.
Valuation Conclusion
Of the five different models tested, GIS appears to be slightly over valued at the moment.
GIS Cash Secured Puts
I don’t feel that GIS is in cash secured put territory at the moment since it appears to be over valued. I would prefer to wait for the price to dip more before I considered selling a put.
Conclusions
Overall, I like GIS. The current starting dividend yield is reasonable and the company has some incredible brand recognition and competitive advantages. However, at present, GIS appears over valued. I would prefer to wait a bit to see if the recent market volatility knocks the price down before I consider investing.,
Disclosure: Nothing to disclose.
Readers: What are your opinions about General Mills?


Written by MFIJ
Filed under: Stock Analysis · Tags: general mills, gis, stock analysis
6 Responses to "General Mills (GIS) Dividend Stock Analysis"
Leave a Reply

Growth looks pretty good. One thing is the conglomerate guys sometimes buy their growth by picking up another brand or company. Often when some new trend takes off. So they should be a pretty stable option for a long time.
OK, got to go eat some cereal now…
I agree. General mills looks really solid. If the price drops I might jump on it.
MFIJ,
Good analysis here. I agree completely. A high quality company that’s just a bit richly valued here. I would love to buy some in the low-to-mid $40′s. I’d be very, very interested in owning a piece of GIS at those levels.
Best wishes!
Nice analysis. General Mills seems to be a well-run company in a stable industry, making it a solid long-term holding. I own GIS and wouldn’t mind adding to my position, but not at the current price. I think I’d need to see it go below $45 to buy more shares.
GIS is another company that I’d love to own. That’s pretty surprising to me that they had a 13% drop in EPS from 2011 to 2012. I wouldn’t expect that kind of drop from a company with such a focus on staples. I wonder if that was do to some one time items or something of that sort.
From what I can tell, 2012 had record corn prices, so I would expect the cost of materials for GIS to have increased thus reducing their EPS.