My Financial Independence Journey » Stock Analysis » Genuine Parts Company (GPC) Dividend Stock Analysis
Genuine Parts Company (GPC) Dividend Stock Analysis
 Genuine Parts Company (GPC) is major distributor of replacement car parts. It operates various distribution centers, import centers, and rebuilding plants. Probably the best known brand under GPC is NAPA, which even the those people as clueless about cars as myself has heard of. GPC has operations in the US (87% of sales), Mexico (13% of sales), Canada, and Australia. GPC has been expanding through growth and acquisitions. GPC is divided into four main business segments. The automotive parts segment (50% of profits) sells auto parts to garages, service stations, and fleet operators. The industrial parts segment (33% of profits) sells parts for industrial vehicles like agricultural equipment. The office products group (SP Richards Co, 12% of profits) sells, as you might expect, office furniture and supplies. Not a typo, they actually run an office supply company. Finally, there is also an electrical materials group (5% of profits).
GPC Basic Company Stats
- Ticker Symbol: GPC
- PE Ratio: 18.49
- Yield: 2.6%
- % above 52 week low: 87.2%
- Beta: 0.68
- Market cap: $17.73 B
- Website: www.genpt.com
GPC vs the S&P500 over 10 years

GPC was roughly tracking the S&P500 until 2009 when it started to significantly outperform it. Over the last 10 years, an investment in GPC would have grown by 158% compared to the 70% that an investment in the S&P500 would have grown.
GPC Earnings Per Share (EPS) & Dividend Growth
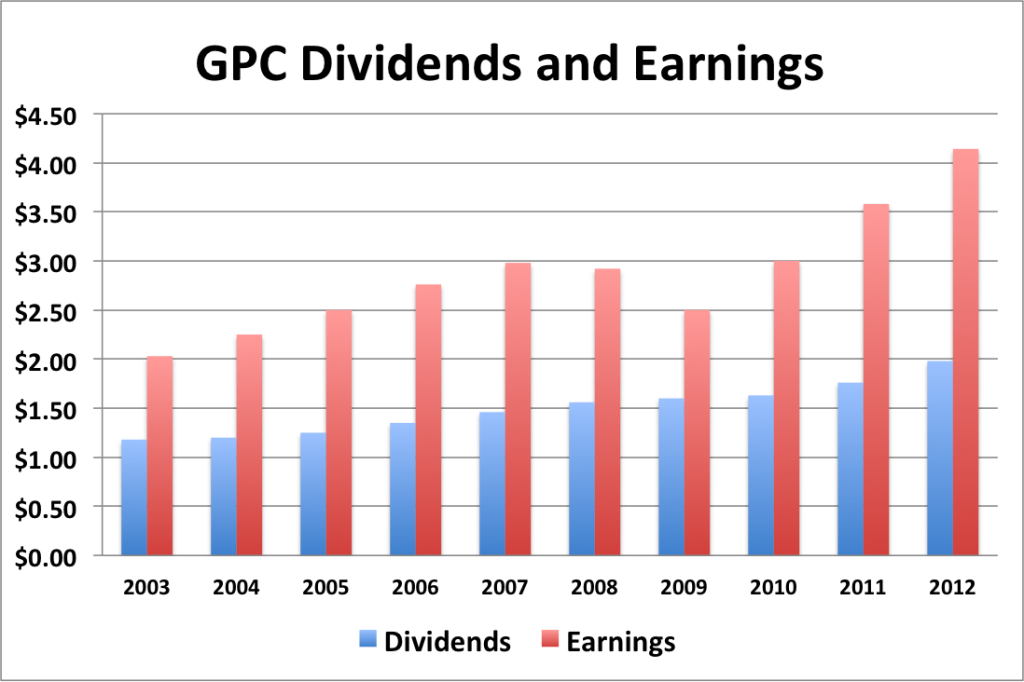
- 1 year EPS growth: 15.6%
- 3 year EPS growth: 17.5%%
- 5 year EPS growth: 9.1%%
- 10 year EPS growth: 8.2%
EPS growth for GPC has been solid over the last 10 years and appears like it is accelerating over the last 3-5 years. There was a dip in 2009, linked to the Recession, but nothing to be particularly worried about.
- 1 year dividend growth: 12.5%%
- 3 year dividend growth: 10.2%
- 5 year dividend growth: 6.1%
- 10 year dividend growth: 5.9%%
GPC’s dividend growth is slow over a 5-10 year time frame, but appears to be increasing in the more recent 1-3 year timeframe. Judging by
With a starting yield of 2.6% and a growth rate of about 10%, GPC’s yield on cost will grow to well in excess of 6.5% in 10 years. In order to double the dividend, using the rule of 72, it will take less than 7.2 years.
GPC Payout Ratio
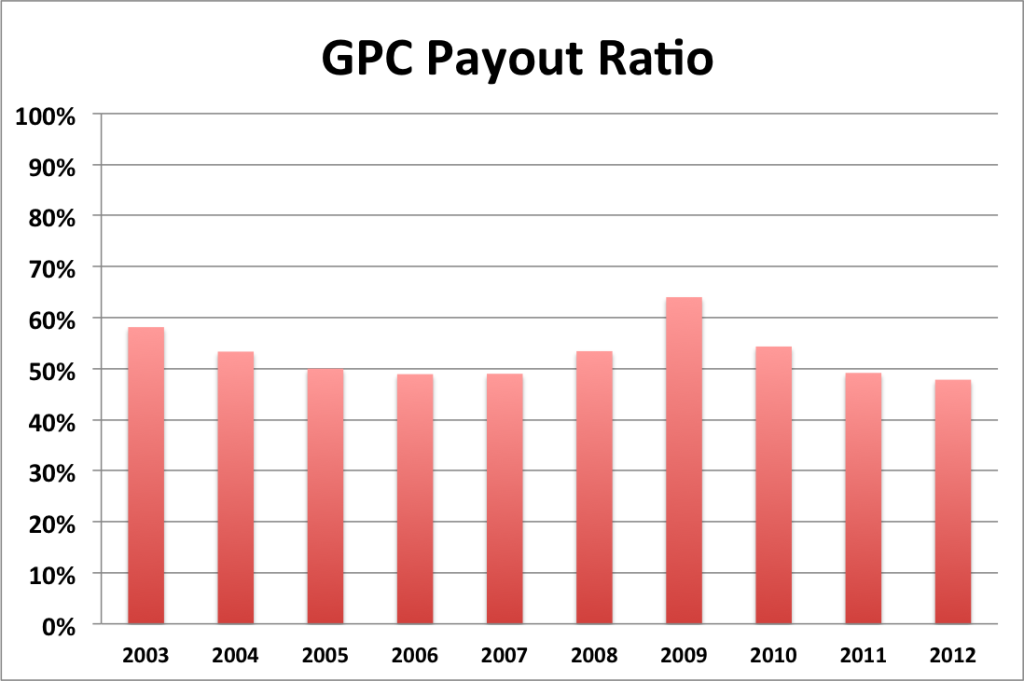
GPC’s payout ratio has remained very stabile over the last 10 years. The average payout ratio is 53% and it appears as though that’s where the GPC management would like to keep it.
GPC Cash Flow & Revenue Growth
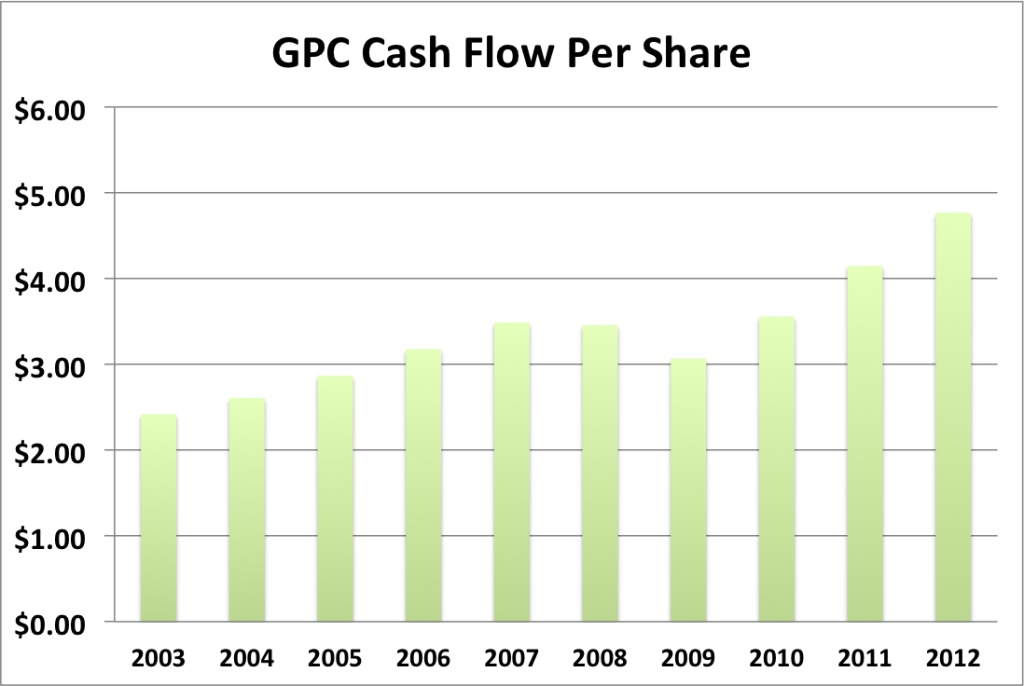
- 1 year revenue growth: 4.5%
- 3 year revenue growth: 7.8%
- 5 year revenue growth: 4.3%
- 10 year revenue growth: 4.9%
Cash flow for GPC has generally mirrored EPS growth. Revenue growth has been very constant hovering between 4 and 5% for the last 10 years. Overall, GPC appears to be a stabile slow grower.
GPC Balance Sheet
The current debt to equity ratio for GPC is about % and has been on the low end for the last 10 years.
GPC Risks
GPC is the largest automotive aftermarket company, however it only represents about 5-6% of the total aftermarket products industry, so there is nowhere near as much of a moat as you might expect. Should an aggressive and well managed company enter the field, it could chip away at GPC’s customers. However, it should be noted that GPC is fiscally and strategically conservative as is evident by GPC’s 57 year history of increasing dividends. GPC has faced all kinds of problems during that time, from both competition and macroeconomic factors, and has successfully weathered them all.
GPC is less susceptible to the business cycle than you may think. During economic downturns, it becomes more likely that people will try to keep old cars running rather than buying new ones, which offers some buffer against business that would otherwise be lost. So long as the US is dependent on automobiles for transportation, GPC will continue to thrive.
GPC Valuation Panel
Graham Number
The Graham number represents one very simple way to value a stock. The Graham number for GPC is $44.52. The stock price is higher than the Graham number, suggesting that GPC may be slightly overvalued valued at the moment.
Two Stage Dividend Discount Model
Using a risk free rate of 2%, an expected return of 10% and the beta of 0.68, the CAPM model provides a discount rate of 21.0%. Using a growth rate of 12% for 5 years and a slower growth rate of 7%, the two stage model produced a value of $35.41, suggesting that GPC is overvalued. I also tried this model with a discount rate of 10% and got $97.41, suggesting that GPC is undervalued.
One Stage (Gordon Growth) Dividend Discount Model
Using a growth rate of 12.0% and a 10% discount rate, the one stage model produces a value of $70.00, suggesting that GPC is overvalued.
Valuation Conclusion
Of the models tested, most suggest that GPC is overvalued at this moment.
GPC Cash Secured Puts
As much as I like GPC, I’m not convinced that now is the time to sell puts against it. But if you want to initiate a position, a put might be a good way to get lower entry cost.
Conclusions
GPC is a great company with a long history of raising dividends. Unfortunately, like much of the market, it’s currently overvalued. I’d wait for the either the price to drop or the yield to rise before I consider adding to my position.
Disclosure: Long GPC.
Readers: What are your opinions about Genuine Parts Company?


Written by MFIJ
Filed under: Stock Analysis · Tags: genuine parts company, gpc, stock analysis
One Response to "Genuine Parts Company (GPC) Dividend Stock Analysis"
Leave a Reply

[…] 2. My Financial Independence Journey reviews the dividend stock Genuine Parts (GPC) […]