My Financial Independence Journey » Stock Analysis » Target (TGT) Dividend Stock Analysis
Target (TGT) Dividend Stock Analysis
 Target (T) is a major retailer with approximately 1,800 stores across the US and Canada. Target stores generally cater to middle- and upper-income consumers, carrying a broad assortment of fashion apparel, electronics, home furnishings, household products and other general merchandise. Super-Target stores also carry a full line of groceries. CityTargets are slightly smaller and tailored toward urban markets. Target also offers a credit card to qualified customers. Target has been aggressively building new stores and working to increase same store sales at its existing locations. Aggressive promotion of Target’s credit card (and its associated in store discount) also serves to increase same store sales.
TGT Basic Company Stats
- Ticker Symbol: TGT
- PE Ratio: 15.37
- Yield: 2.7%
- % above 52 week low: 37.1%
- Beta: 0.6
- Market cap: $40.24 B
- Website: www.target.com
TGT vs the S&P500 over 10 years
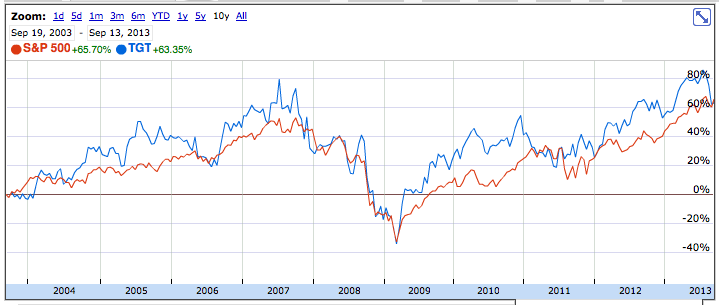
TGT has generally tracked the S&P500 over the last 10 years. An investment in TGT would have grown by about 63%. The S&P500 would have experienced a gain of approximately 66%.
TGT Cash Flow & Revenue Growth
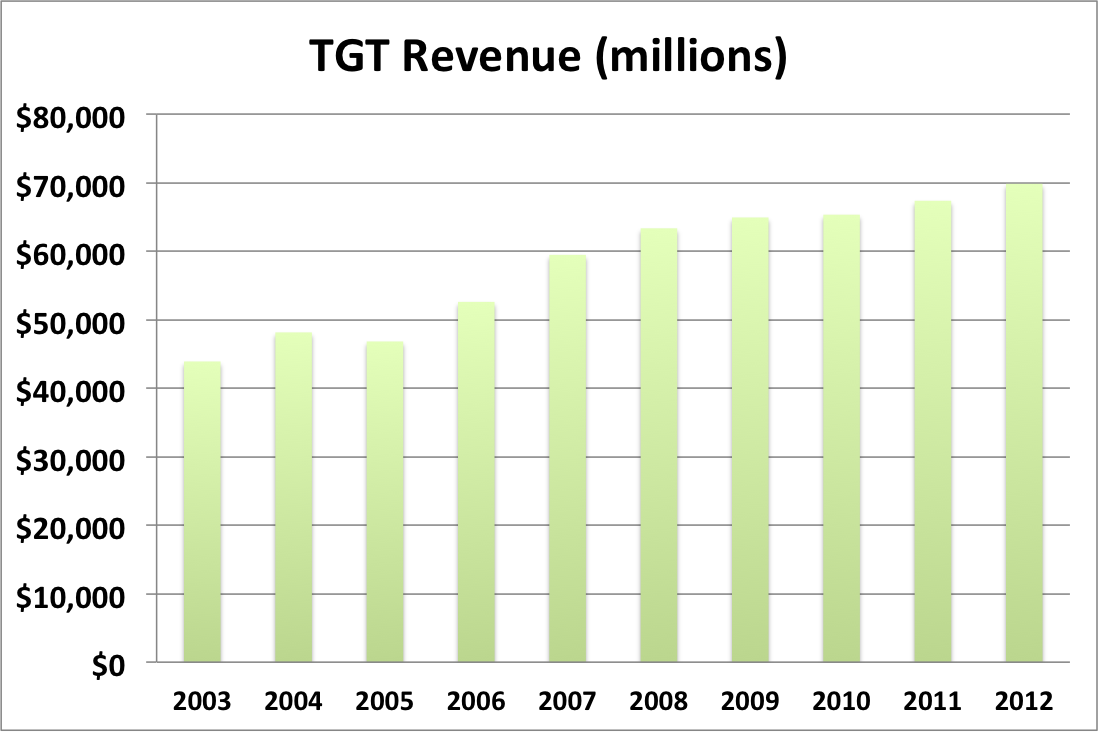
- 1 year revenue growth: 3.7%
- 3 year revenue growth: 3.4%
- 5 year revenue growth: 2.5%
- 10 year revenue growth: 5.3%
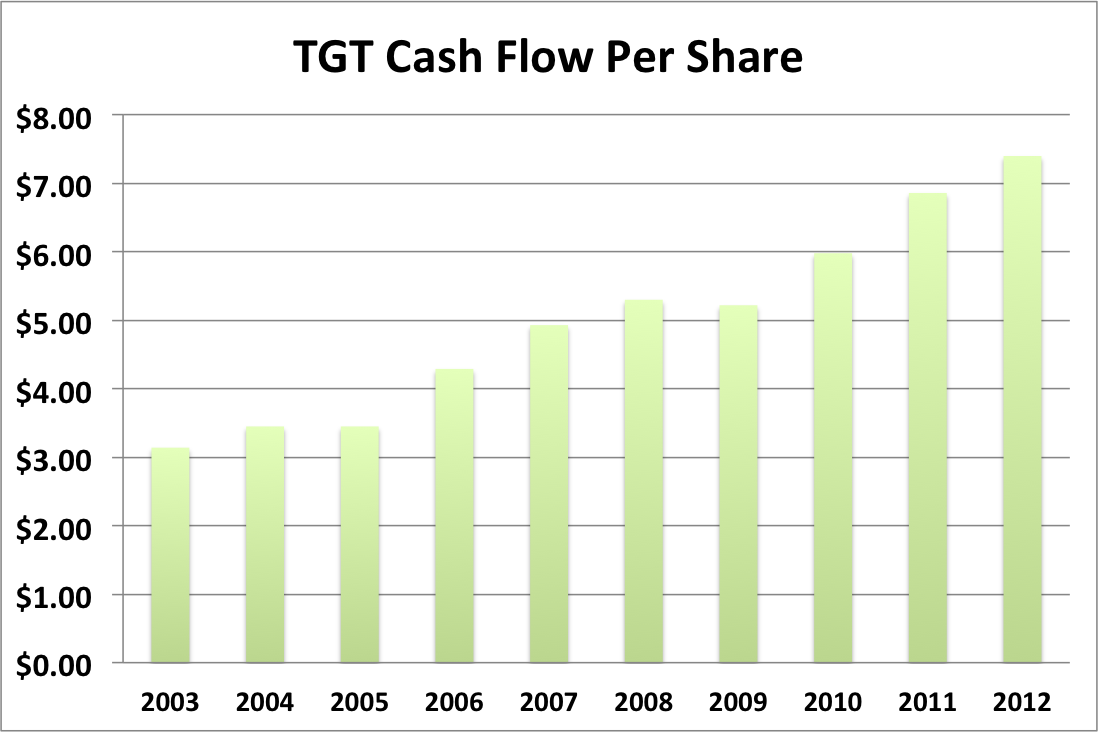
Revenue growth for TGT has been steadily moving upwards over the last 10 years. For the last five years, revenue growth appears to be leveling off around 3%. Maybe a bit more as the economy picks up again and people begin spending more money. Similarly, cash flow (see below graph) has also been steadily rising over the last 10 years.
TGT Earnings Per Share (EPS) & Dividend Growth
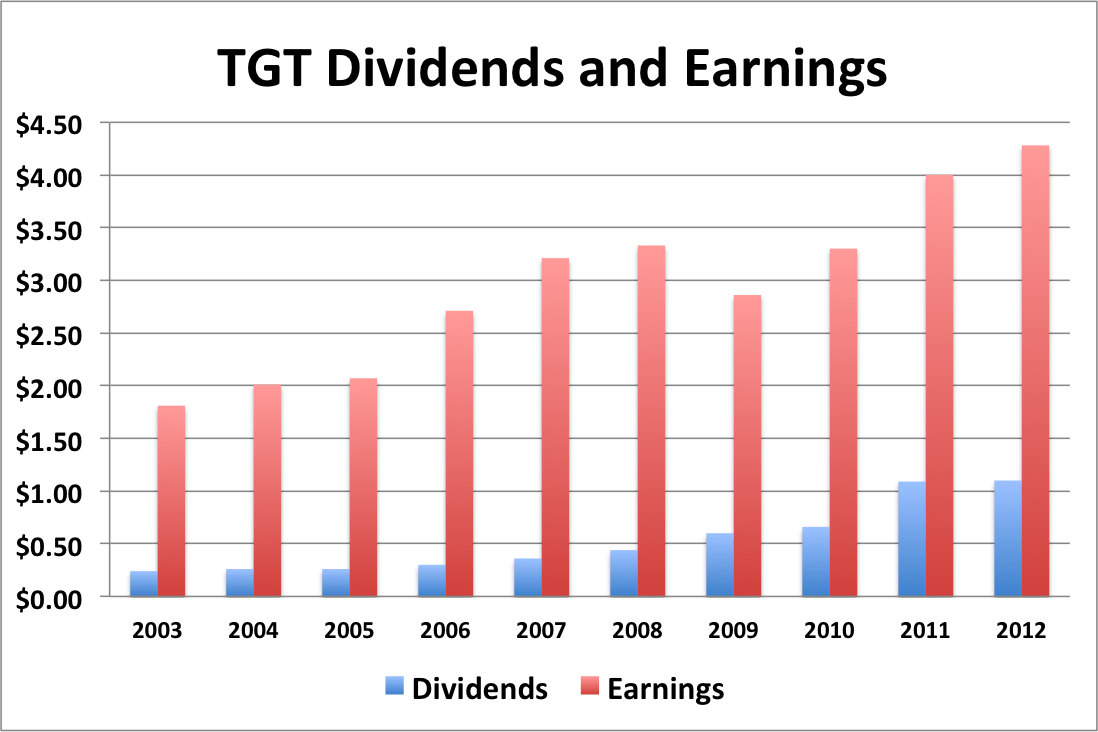
- 1 year EPS growth: 7.0%
- 3 year EPS growth: 13.9%
- 5 year EPS growth: 6.5%
- 10 year EPS growth: 10.0%
Mirroring what we saw with revenue and cash flow, EPS has been moving steadily upwards. However there was a noticeable dip in 2009, but it’s not something that I could consider worrying about. Now, let’s see how dividends stack up to cash flow.
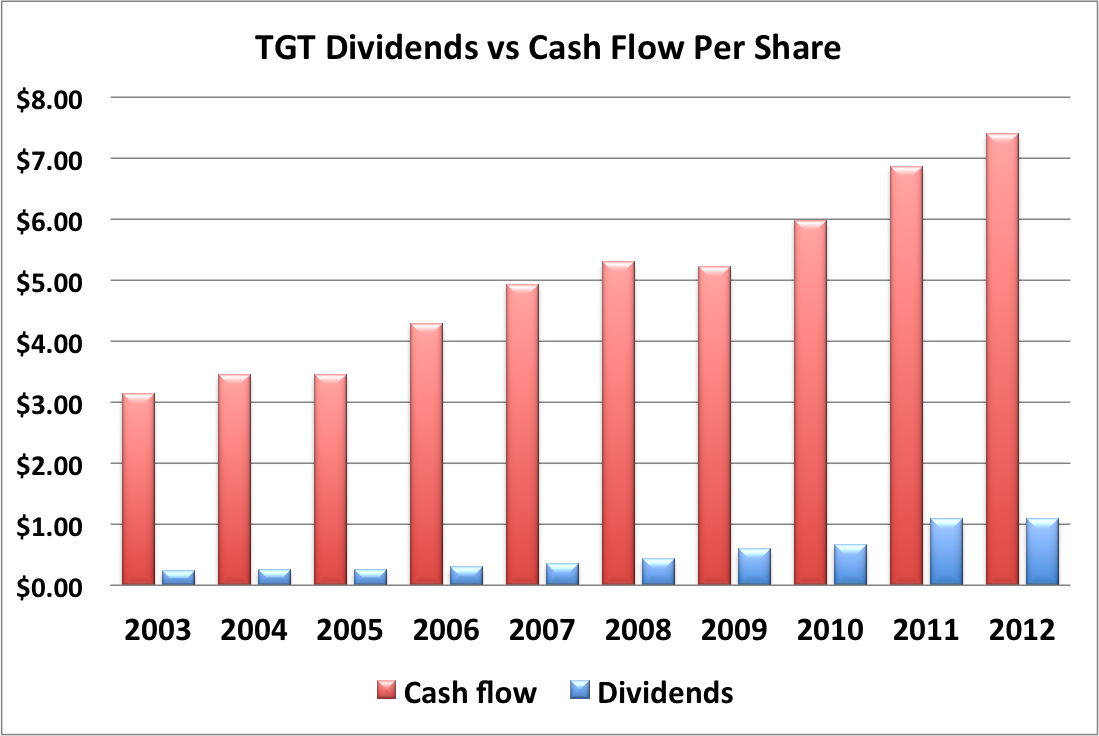
TGT’s cash flow generally mirrors the EPS data. And in both cases, it’s pretty obvious that the dividend is more than adequately covered and has plenty of room to grow.
- 1 year dividend growth: 0.9%
- 3 year dividend growth: 29.1%
- 5 year dividend growth: 25.7%
- 10 year dividend growth: 18.4%
A quick word on dividend growth. In 2012 TGT’s dividend barely grew at all. But in 2013, TGT raised its dividend by 20% So I would not consider dividend growth to be compromised based on the last year.
TGT’s dividend growth is slow and steady at around 20% or so.
With a starting yield of 2.7% and a growth rate of about 20%, T’s yield on cost will grow to over 15% in 10 years. In order to double the dividend, using the rule of 72, it will take about 3.6 years.
TGT Payout Ratio
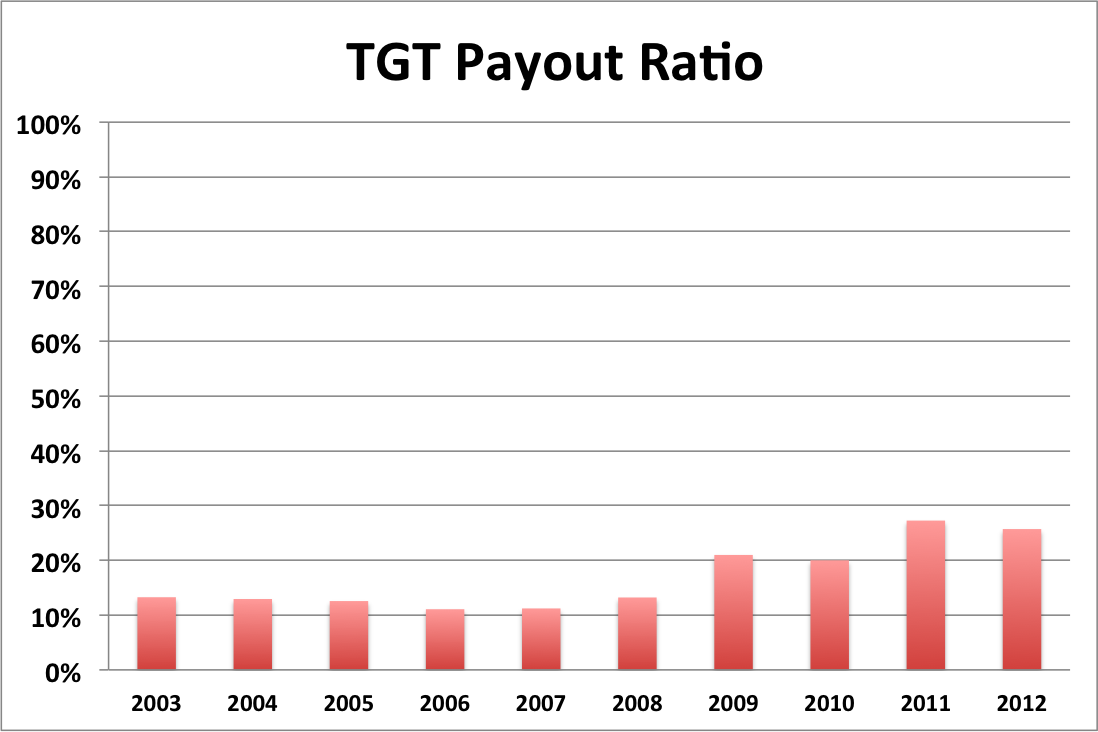
As you probably could have guessed based on the above comparison of dividends to earnings, the payout ratio as traditionally calculated is low. The lower the payout ratio, the more room there is for the dividend to grow in the future. TGT’s payout ratio hasn’t even hit 30% yet, so there is a lot of room for growth.
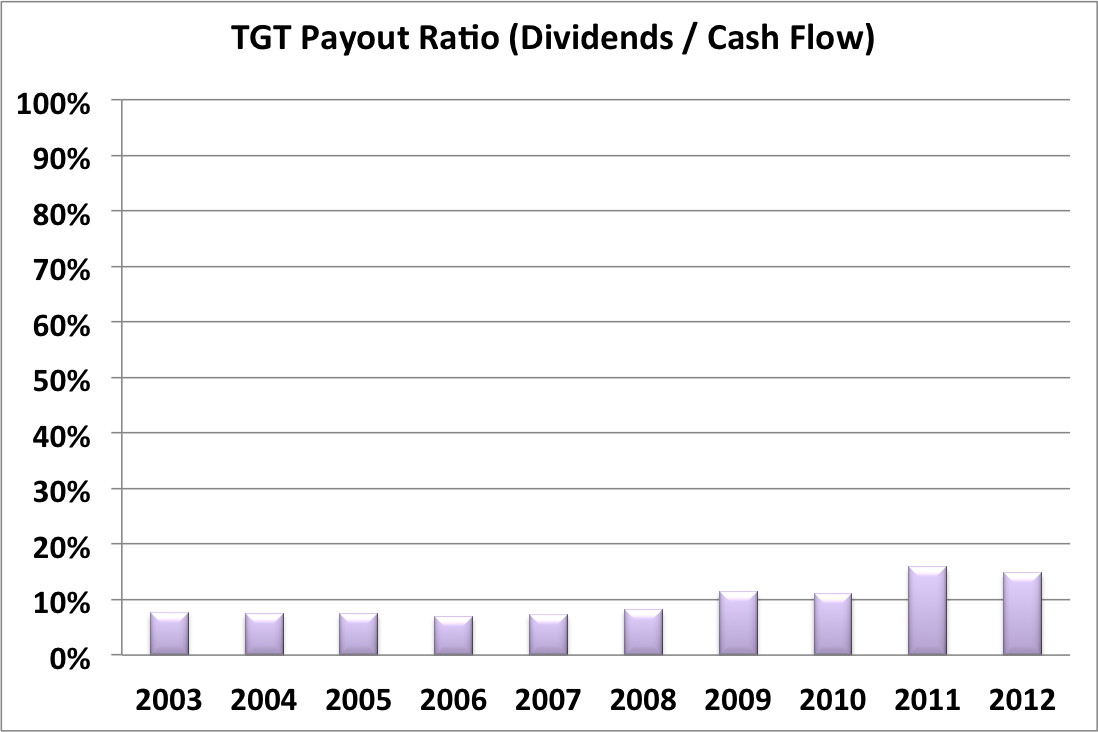
When the payout ratio is compared to cash flow, a very similar story emerges. A low payout ratio with plenty of room to grow.
TGT Balance Sheet
The current debt of capitalization is 43% and has remained around that level for the last five years.
TGT Risks
Target faces competition from the other retail giant, Wal-Mart (WMT). While there is very little in the way of merchandise price difference between the two, Target has successfully distinguished itself as the retailer of choice for the middle and upper class. In Canada, sales at Target stores are not growing as rapidly as investors would like, but I expect that sales will reach anticipated levels soon.
Of course, the economic recovery deserves some mention. As the economy continues to improve, I would expect Target’s sales to improve as well as people get more discretionary income to spend.
TGT Valuation Panel
Graham Number
The Graham number represents one very simple way to value a stock. The Graham number for TGT is $48.69. The stock price is higher than the Graham number, suggesting that TGT may be overvalued valued at the moment.
Two Stage Dividend Discount Model
Using a discount rate of 10%, an initial growth rate of 20% for 5 years and a slower growth rate of 7%, the two stage model produced a value of $107.75, suggesting that the stock is undervalued.
One Stage (Gordon Growth) Dividend Discount Model
Given the incredible dividend growth rate, the one stage model may not be that accurate for this stock at this time.
Historical Yield Comparison

This figure is built by plotting the highest dividend yield each year (red line) and the lowest dividend yield of each year (blue line). Basically, I took the yearly divided it by the yearly high and low of the stock price to get the two yields. The green line represents the current dividend yield. The closer the green line comes to the red line, the more undervalued the stock is. Since the green line is slightly above the red line, TGT may be undervalued at present.
Note: This valuation method was adapted from JC at www.passive-income-pursuit.com.
Valuation Conclusion
Two out of three of the valuation models tested suggest that TGT is currently undervalued.
TGT Cash Secured Puts
TGT does appear to be undervalued at the moment and I like the company over all. I would consider selling puts against it, but might want to wait until the price drops a bit if you want to dodge assignment. The market overall is in an overvalued state and a correction could drag TGT’s price down and make it a good candidate for selling puts against.
Conclusions
Overall I like TGT as a company. I’d like to see the yield increase a bit before buying, but given the dividend growth, this 2.7% yielding stock is worth grabbing up.
Disclosure: Nothing to disclose
Readers: What are your opinions about Target?


Written by MFIJ
Filed under: Stock Analysis · Tags: stock analysis, target, tgt
3 Responses to "Target (TGT) Dividend Stock Analysis"
Leave a Reply to Roadmap2Retire Cancel reply

Thanks for the Dividend Stock Analysis. TGT has been on my watchlist for the past couple of months and am considering picking it up.
I recently added to my TGT position based on the fact that the average dividend yield indicates the stock is undervalued and there is not much value in the current market. I also think TGT’s entry into Canada will be beneficial to future company earnings.
Nice site by the way. I found it through Passive Income Pursuit.
Thanks for the compliment. I’ve been looking at Target as well, but would like to see the price drop a bit more. I also think that TGT’s entry into Canada will be beneficial, even if it hasn’t moved as fast as analysts would have expected.